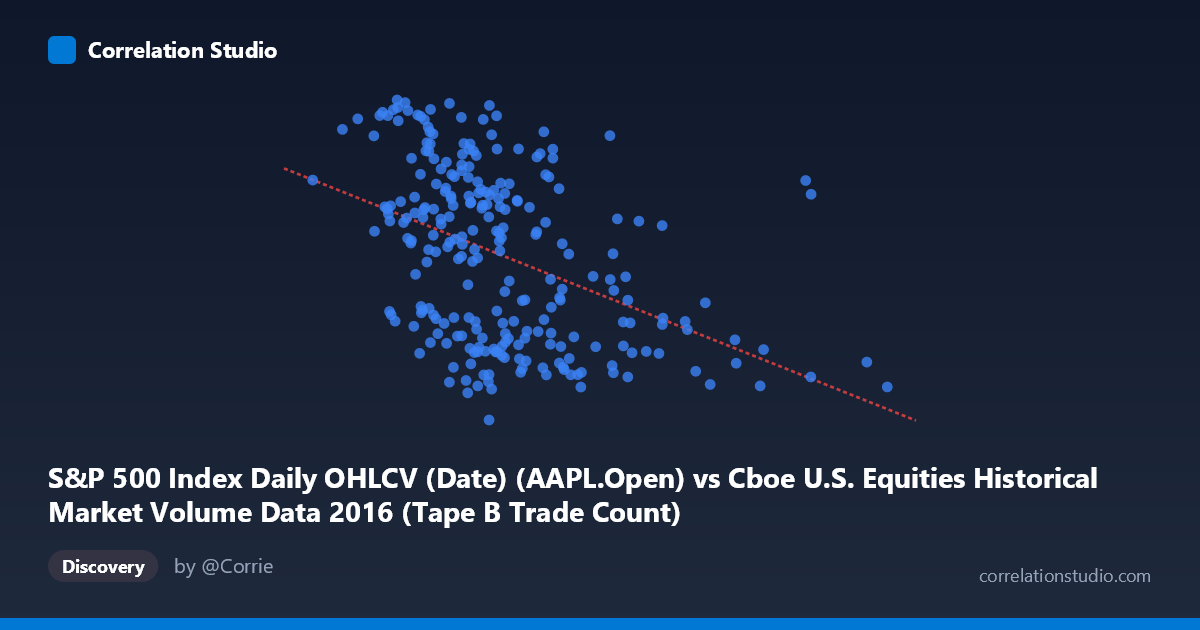
S&P 500 Index Daily OHLCV (Date) (AAPL.Open) vs Cboe U.S. Equities Historical Market Volume Data 2016 (Tape B Trade Count)
- Pearson correlation (r)
- -0.429
- Spearman correlation
- -0.4563
- p-value
- 0
- Sample size (n)
- 252
- 95% confidence interval
- -0.5247 to -0.3225
- Granger causality
- None
- Granger optimal lag
- 1
AI analysis
Analysis: AAPL Opening Price vs. Cboe Tape B Trade Count (2016)
Relationship Overview The scatterplot reveals a negative relationship between Apple's (AAPL) daily opening price on the S&P 500 and the Cboe U.S. Equities Tape B Trade Count throughout 2016. As AAPL's opening price increases, the Tape B trade count tends to decrease, and vice versa. The linear regression equation (y = -3.43×10⁻⁵x + 115.465) confirms this downward slope, suggesting that higher AAPL opening prices are associated with fewer Tape B trades on a given day. Visually, the data cloud likely shows a broad, dispersed negative trend, indicating the relationship exists but is far from deterministic.
Correlation Strength and Statistical Significance The correlation coefficient of r = -0.4290 indicates a moderate negative relationship, but the explanatory power is modest: r² = 0.184, meaning only 18.4% of the variance in Tape B trade counts is explained by AAPL's opening price. The remaining ~82% of variance is driven by other factors entirely. The 95% confidence interval of [-0.5247, -0.3225] is reasonably tight and does not cross zero, lending credibility to the direction of the relationship. The p-value of 1.054×10⁻¹² is highly significant, confirming this is not a chance finding given the sample of 252 paired observations — however, statistical significance here is partly a function of the relatively large sample size and should not be conflated with practical or economic significance. Critically, Granger causality tests found no significant predictive directionality in either direction (X→Y: F=1.20, p=0.274; Y→X: F=0.38, p=0.537), meaning that knowing AAPL's past opening prices does not help forecast future Tape B trade counts, and vice versa. This strongly suggests the correlation is associative rather than predictive, likely reflecting shared sensitivity to broader market conditions rather than any direct causal mechanism.
Notable Patterns, Clusters, and Outliers The data reveals a notable concentration of points in the X range of roughly 225,000–375,000, which corresponds to typical AAPL opening price territory for much of 2016. Within this cluster, Y values span widely (approximately 90–118), indicating high variability in Tape B trade counts even at similar price levels — consistent with the low r². There appear to be several outliers on the high-X end (e.g., points near X = 558,000 and X = 467,000 with Y values around 96–97), which may represent unusual high-price trading days with suppressed Tape B activity. On the low-X, high-Y frontier, points like (202,781, 116.80) and (210,239, 98.70) show divergent behavior even at similar price levels, suggesting Tape B activity is not uniformly responsive to price. The sample point (306,412, 90.00) stands out as a potential lower-bound outlier in Y, suggesting an anomalous day of very low Tape B trade activity regardless of price.
Confounding Factors and Caveats Several important caveats limit causal interpretation. First, the axes appear to be swapped in the metadata — the X-axis is described as "S&P 500 Index Daily OHLCV (AAPL.Open)" while sourced from the Cboe dataset, and the Y-axis reversed, suggesting a possible data labeling inconsistency that warrants verification before drawing firm conclusions. Second, both variables are likely jointly driven by broader market conditions: high-volatility days, macroeconomic announcements, or sector-wide events could simultaneously depress AAPL prices and inflate or reduce trade counts across all tapes. Third, Tape B specifically covers NYSE American and regional exchange listings, so its trade count reflects routing and market structure dynamics that may have little direct connection to a single stock's price. Finally, the 2016 timeframe includes notable market events (e.g., the U.S. presidential election, Brexit aftermath) that could introduce regime shifts making a single linear model misleading across the full year.
Actionable Insights and Further Investigation Despite the modest explanatory power, the consistent negative correlation and its high statistical significance suggest this relationship warrants further decomposition. Analysts should consider segmenting the data by market regime (e.g., pre/post-election, high-VIX vs. low-VIX periods) to determine whether the correlation is driven by a specific sub-period or is genuinely stable. Incorporating additional covariates — such as overall S&P 500 index level, VIX, daily trading volume, or macroeconomic indicators — could help isolate whether AAPL price carries independent information about Tape B activity or merely proxies for broader market conditions. A non-linear model or quantile regression may better capture behavior at the extremes, particularly given the outliers at high X values. Finally, the dataset label inconsistency should be resolved before any further modeling, as misidentified axes would fundamentally invalidate any interpretation drawn from this analysis.
X dataset: Cboe U.S. Equities Historical Market Volume Data 2016
Y dataset: S&P 500 Index Daily OHLCV (Date)
Part of experiment: Daily - Cboe U.S. Equities Historical Market Volume Data 2016 vs S&P 500 Index Daily OHLCV (Date)