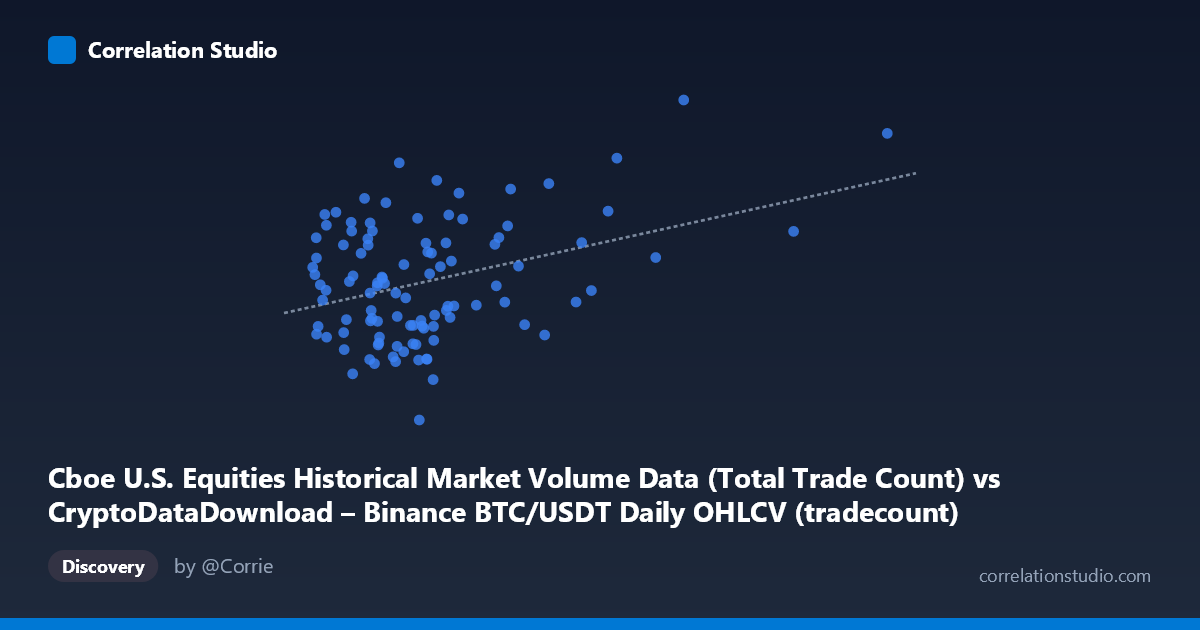
Cboe U.S. Equities Historical Market Volume Data (Total Trade Count) vs CryptoDataDownload – Binance BTC/USDT Daily OHLCV (tradecount)
- Pearson correlation (r)
- 0.3635
- Spearman correlation
- 0.1706
- p-value
- 0.000149
- Sample size (n)
- 104
- 95% confidence interval
- 0.1838 to 0.5197
- Granger causality
- None
- Granger optimal lag
- 10
AI analysis
Analysis of the Relationship Between Trade Count Variables
1. Overview of the Visualization
The scatterplot shows a positive but noisy relationship between two trade-count-like metrics (labeled here as Cboe equities volume and Binance BTC/USDT tradecount, though the axis labels appear cross-mismatched in the metadata). The bulk of observations cluster tightly in the X range of ~2.3M–6M, with Y values spanning roughly 6M–8.4M. A small number of high-leverage points extend the X range out to 15.4M, and these points disproportionately anchor the upward slope of the regression line.
2. Strength, Direction, and Statistical Confidence
The correlation coefficient (r = 0.475) indicates a moderate positive linear relationship. However, r² = 0.226 shows that only about 22.6% of the variance in Y is explained by X — meaning roughly 77% of Y's variability is driven by other factors, noise, or nonlinear dynamics not captured here. The 95% confidence interval [0.297, 0.621] is fairly wide but stays safely above zero, and the p-value (2.2×10⁻⁶) confirms the correlation is highly unlikely to be due to chance in this sample. That said, statistical significance here reflects consistency of a modest linear association — not necessarily practical strength or predictive precision. Notably, the Granger causality tests found no significant predictive direction (X→Y: p = 0.165; Y→X: p = 0.439), suggesting that neither variable's past values meaningfully forecast the other's future values at the tested lag structure (optimal lag = 10). This is an important caveat: correlation exists in level/contemporaneous terms, but not in a temporal lead-lag sense.
3. Notable Patterns and Outliers
Most of the data forms a dense, roughly linear-looking cloud in the lower-X region, but with substantial vertical scatter (Y ranging from ~5.2M to ~8.6M) even within a narrow X band (3M–5M) — indicating high noise or an unaccounted-for factor driving Y independent of X. A handful of extreme X outliers (e.g., X ≈ 15.36M, 13.2M, 10.7M, 10.1M) sit far from the main cluster and exert strong leverage on the regression slope; removing them could substantially change the fitted line and r² value. There's no clear evidence of curvature, but the sparse high-X tail makes it hard to assess whether the relationship holds, saturates, or reverses at larger scales.
4. Confounding Factors and Caveats
Given both series originate from cryptocurrency/equity trading volume data over a short window (Jan–May 2026), they likely share common confounders: overall market-wide volatility, macroeconomic news cycles, or general growth in trading activity across asset classes over time (both could be independently trending upward due to a bull market period, creating spurious correlation via a shared time trend rather than a direct causal link). The n=90 paired sample is also much smaller than the stated population (1,980), so results may not generalize fully. Additionally, the axis-label mismatch in the metadata (Cboe column mapped to X, Binance tradecount to Y, with descriptions swapped) raises concerns about data provenance — this should be verified before drawing domain conclusions.
5. Suggested Next Steps
To clarify the relationship, analysts should: (1) investigate and correct the axis/label metadata mismatch, (2) test the correlation's robustness by re-running with the extreme high-X outliers excluded or winsorized, (3) explore a shared trend/seasonality model (e.g., detrending both series or using differenced data) to distinguish genuine co-movement from common time trends, and (4) given the null Granger result, avoid using one series to forecast the other operationally — instead treat them as contemporaneously associated but independently evolving series, and consider third-variable candidates (e.g., aggregate market volatility index) as a joint driver.
X dataset: CryptoDataDownload – Binance BTC/USDT Daily OHLCV
Y dataset: Cboe U.S. Equities Historical Market Volume Data
Part of experiment: Bitcoin - CryptoDataDownload – Binance BTC/USDT Daily OHLCV vs Cboe U.S. Equities Historical Market Volume Data