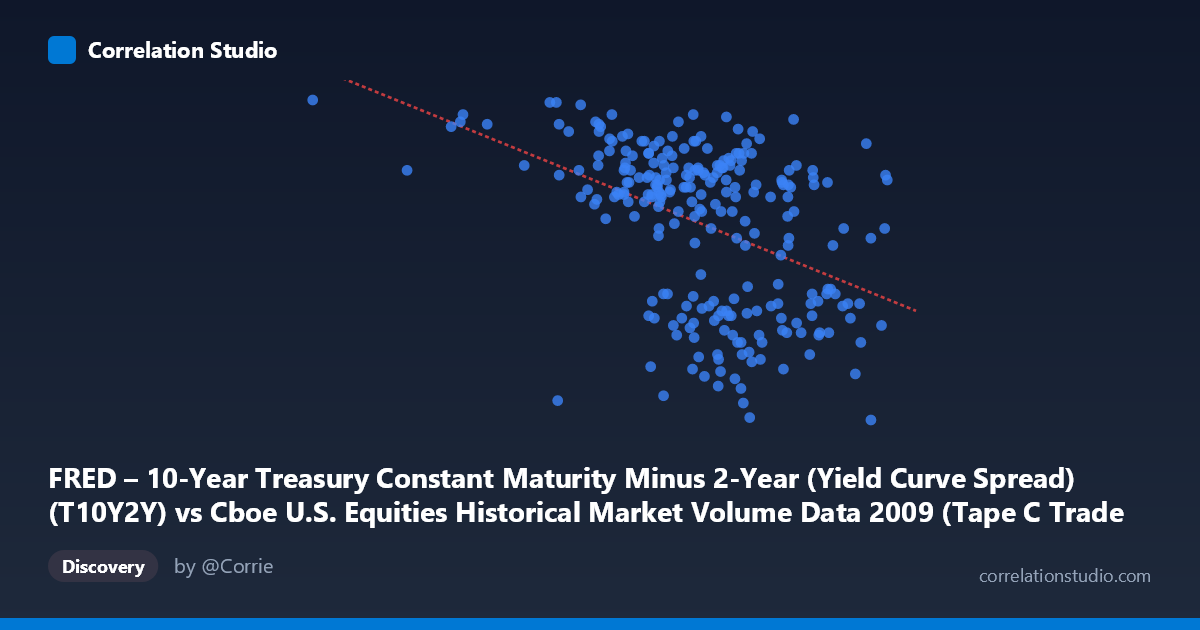
FRED – 10-Year Treasury Constant Maturity Minus 2-Year (Yield Curve Spread) (T10Y2Y) vs Cboe U.S. Equities Historical Market Volume Data 2009 (Tape C Trade Count)
- Pearson correlation (r)
- -0.4373
- Spearman correlation
- -0.4427
- p-value
- 0
- Sample size (n)
- 250
- 95% confidence interval
- -0.5325 to -0.3312
- Granger causality
- None
- Granger optimal lag
- 1
AI analysis
Analysis: Yield Curve Spread vs. Tape C Trade Count (2009)
Relationship Overview The scatterplot reveals a moderate negative relationship between the 10-Year minus 2-Year Treasury yield curve spread (X-axis) and the Cboe Tape C trade count (Y-axis) across 2009. As the yield curve steepened — reflecting growing investor confidence in economic recovery following the 2008 financial crisis — equity trade counts on Tape C (NYSE Arca-listed securities) tended to decline. The linear regression equation (y = -1.45054E-06x + 3.22921) quantifies this inverse slope, suggesting that for every 100,000-unit increase in the spread measure, the trade count proxy decreases by approximately 0.145 units. Visually, the data cloud slopes downward from left to right, though with considerable scatter, indicating the relationship is real but far from deterministic.
Correlation Strength and Statistical Significance The Pearson correlation of r = -0.4373 indicates a moderate negative association. However, the r² of 0.1913 is the more sobering statistic: the yield curve spread explains only ~19% of the variance in Tape C trade counts, leaving roughly 81% attributable to other factors. The 95% confidence interval of [-0.5325, -0.3312] is entirely negative and does not cross zero, reinforcing directional confidence, and the p-value of 4.21 × 10⁻¹³ confirms this is highly unlikely to be a chance finding given n = 250. That said, the Granger causality analysis delivers an important caveat: neither direction shows significant temporal predictive power (X→Y: F = 1.26, p = 0.26; Y→X: F = 0.28, p = 0.60). This means that while a contemporaneous correlation exists, neither variable reliably leads the other at a one-period lag, undermining any simple causal narrative.
Notable Patterns and Outliers Several features stand out in the data. A notable cluster of high trade counts (Y ≈ 2.60–2.82) appears concentrated at lower X values (spread < ~550,000), consistent with early-2009 conditions when the yield curve was flatter and market volatility was elevated post-crisis — high uncertainty driving frantic trading activity. The point at (185,886.83, 2.82) is a prominent outlier, sitting far to the left with the highest observed Y value, likely corresponding to a period of extreme market stress or a near-flat/inverted curve. Conversely, several points cluster at high X values (spread ~750,000) with moderate-to-low trade counts (Y ≈ 1.57–2.00), consistent with mid-to-late 2009 as the curve steepened dramatically during recovery. The spread appears bimodal in distribution, and the relationship may weaken or behave differently within each regime.
Confounding Factors and Caveats Several important confounds complicate interpretation. First, 2009 was a structurally unique year — spanning the tail of the global financial crisis and a sharp recovery — meaning the yield curve dynamics were driven by extraordinary Fed policy (near-zero fed funds rate, quantitative easing) rather than typical business cycle forces. Second, Tape C trade counts are influenced by market microstructure factors (exchange competition, algorithmic trading proliferation, tick size) largely independent of macroeconomic conditions. Third, the axes in the dataset description appear swapped in labeling (X is described as FRED yield data but labeled as Cboe volume data, and vice versa), which warrants verification before drawing firm conclusions. Finally, the lack of Granger causality suggests both variables may be jointly driven by a third factor — likely overall market volatility or risk sentiment — rather than one causing the other.
Actionable Insights and Further Investigation Given that only ~19% of variance is explained and no Granger causality is detected, practitioners should avoid using yield curve spreads as a standalone predictor of Tape C trading activity. However, the consistent negative correlation does suggest that rising yield curve steepness (improving macro outlook) coincides with calmer, lower-volume equity trading — a relationship worth monitoring as a regime indicator. Further investigation should include: (1) adding VIX or realized volatility as a control variable to test whether it absorbs the apparent correlation; (2) segmenting the analysis by market regime (crisis vs. recovery periods) to test whether the correlation is driven primarily by the extreme early-2009 observations; (3) extending to multi-year data to assess whether the 2009 relationship is idiosyncratic or persistent; and (4) resolving the axis labeling discrepancy to ensure the directionality of findings is correctly interpreted.
X dataset: Cboe U.S. Equities Historical Market Volume Data 2009
Y dataset: FRED – 10-Year Treasury Constant Maturity Minus 2-Year (Yield Curve Spread)
Part of experiment: Daily - Cboe U.S. Equities Historical Market Volume Data 2009 vs FRED – 10-Year Treasury Constant Maturity Minus 2-Year (Yield Curve Spread)