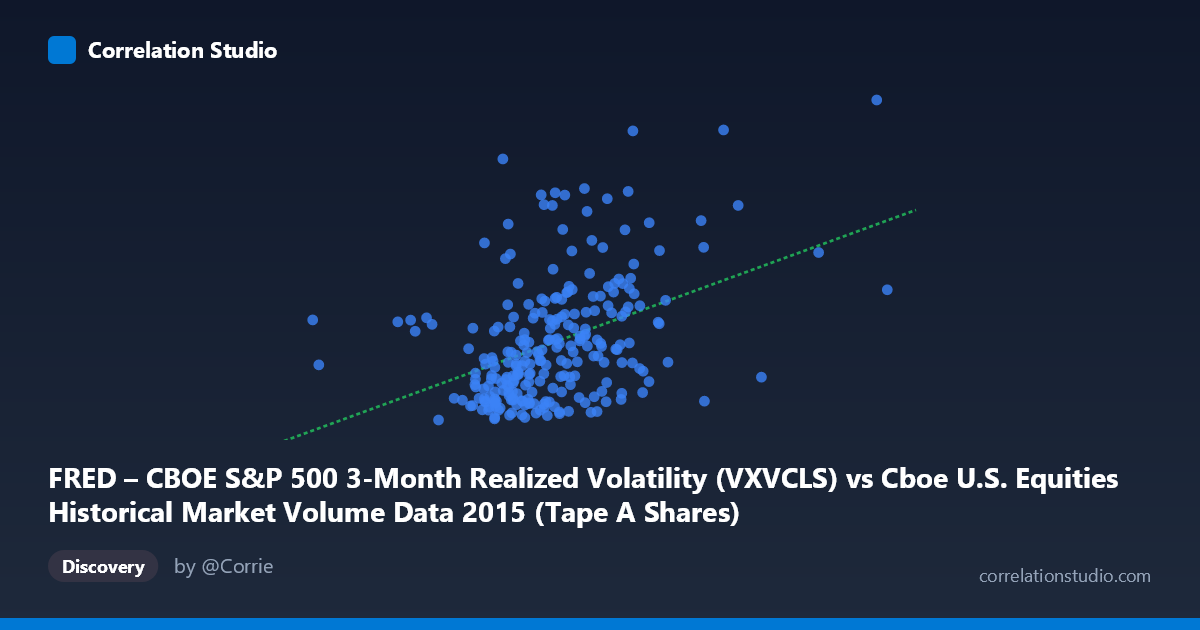
FRED – CBOE S&P 500 3-Month Realized Volatility (VXVCLS) vs Cboe U.S. Equities Historical Market Volume Data 2015 (Tape A Shares)
- Pearson correlation (r)
- 0.4183
- Spearman correlation
- 0.4237
- p-value
- 0
- Sample size (n)
- 252
- 95% confidence interval
- 0.3108 to 0.5153
- Granger causality
- None
- Granger optimal lag
- 1
AI analysis
Analysis: CBOE S&P 500 3-Month Realized Volatility vs. Tape A Shares Volume (2015)
Relationship Overview
The scatterplot reveals a moderate positive relationship between CBOE S&P 500 3-Month Realized Volatility (VXVCLS) and Tape A share volume across U.S. equity exchanges in 2015. The linear regression equation (y = 2.67E-08x + 11.028) indicates that as daily market volume increases, realized volatility tends to rise as well — a directionally intuitive finding, as higher trading activity is commonly associated with periods of market stress or uncertainty. However, the scatter is notably wide across the full range of x-values, suggesting this relationship is far from deterministic and that substantial variability in volatility exists independent of volume levels.
Correlation Strength and Statistical Significance
The correlation coefficient of r = 0.4183 reflects a moderate positive association, but the more telling figure is r² = 0.175 — meaning that daily volume explains only about 17.5% of the variance in realized volatility. The remaining 82.5% is driven by other factors entirely. The 95% confidence interval of [0.3108, 0.5153] is reasonably tight and does not cross zero, lending credibility to the direction of the effect. The p-value of 4.26E-12 confirms that this correlation is highly statistically significant and extremely unlikely to be a chance finding given the sample of n = 252 paired observations drawn from a population of N = 3,302. That said, Granger causality tests return no significant predictive direction in either direction (X→Y: F = 0.017, p = 0.898; Y→X: F = 0.876, p = 0.350), meaning that knowing yesterday's volume does not meaningfully help predict today's volatility, and vice versa. The relationship is contemporaneous rather than predictive, which substantially limits its utility for forecasting or trading signal generation.
Notable Patterns, Clusters, and Outliers
Several structural features are visible in the data. The bulk of observations cluster in the 230M–320M share volume range with volatility between 14–22, forming a relatively dense core. However, there is a meaningful upper-right tail of observations — particularly those exceeding 350M shares and volatility above 23 — that likely corresponds to the late-August 2015 market selloff, a well-documented period of extreme volatility triggered by China growth concerns. Points like (401M shares, ~29.6 vol) and (387M shares, ~23.5 vol) are clear outliers that likely exert disproportionate leverage on the regression fit. On the lower end, several high-volume days show surprisingly low volatility (e.g., ~328M shares at 15.6 vol), indicating that volume spikes can occur in benign, high-liquidity environments as well. This heteroscedasticity — wider variance at higher volume levels — is a red flag for the linear model's reliability across the full range.
Confounding Factors and Interpretive Caveats
Several important caveats apply. First, both variables are time-indexed through 2015, meaning shared macro trends (e.g., the August volatility episode, Fed rate expectations) could be driving co-movement rather than any direct causal link. Second, the axes appear swapped from their natural roles — the dataset labels suggest VXVCLS is on the X-axis and Tape A Shares on the Y-axis, yet the regression slope and units imply volume is the predictor of volatility; users should verify axis assignments carefully. Third, 3-month realized volatility is a lagged, smoothed measure by construction, which partly explains the lack of Granger causality at a 1-day lag — it may respond to volume aggregated over a much longer window. Finally, market microstructure effects (options expiration days, index rebalancing, ETF creation/redemption) can inflate volume without reflecting genuine investor sentiment changes.
Actionable Insights and Further Investigation
Given the statistically significant but explanatorily limited relationship, practitioners should avoid using daily volume as a standalone predictor of realized volatility. More productive next steps would include: (1) testing whether a rolling 60- or 90-day average of volume correlates more strongly with the 3-month realized volatility window, better matching the temporal scale of the VXVCLS measure; (2) segmenting the data into pre- and post-August 2015 regimes to assess whether the correlation is regime-dependent; (3) incorporating VIX or implied volatility alongside volume to test whether the VXVCLS–volume link is mediated by forward-looking fear indicators; and (4) examining whether other tape categories (B, C) or notional value rather than raw share counts yield a stronger signal. The strong statistical significance here is real, but the low r² is a clear warning that a richer, multivariate framework is needed before drawing practical conclusions.
X dataset: Cboe U.S. Equities Historical Market Volume Data 2015
Y dataset: FRED – CBOE S&P 500 3-Month Realized Volatility
Part of experiment: Daily - Cboe U.S. Equities Historical Market Volume Data 2015 vs FRED – CBOE S&P 500 3-Month Realized Volatility