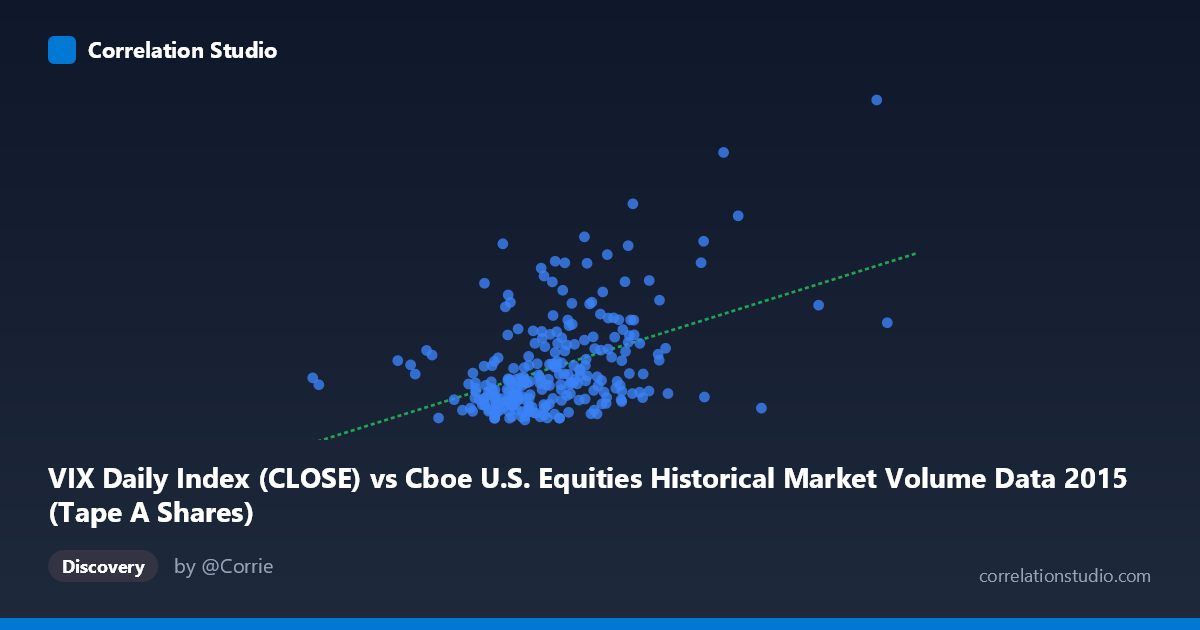
VIX Daily Index (CLOSE) vs Cboe U.S. Equities Historical Market Volume Data 2015 (Tape A Shares)
- Pearson correlation (r)
- 0.4589
- Spearman correlation
- 0.4052
- p-value
- 0
- Sample size (n)
- 252
- 95% confidence interval
- 0.3555 to 0.5512
- Granger causality
- None
- Granger optimal lag
- 1
AI analysis
Scatterplot Analysis: VIX Daily Index vs. Tape A Shares Volume (2015)
Relationship Overview
The scatterplot reveals a moderate positive relationship between the CBOE Volatility Index (VIX) daily close values and Tape A share volume on U.S. equities exchanges throughout 2015. As VIX levels rise — indicating greater market fear or uncertainty — trading volume in Tape A shares tends to increase correspondingly. This is an intuitively sensible relationship: elevated volatility typically drives higher trading activity as market participants react to uncertainty, reposition portfolios, or execute hedging strategies. The linear regression equation (y = 3.967E-08x + 5.574) confirms a positive slope, though the scatter around the regression line is considerable, suggesting the relationship is real but far from deterministic.
Correlation Strength and Statistical Significance
The Pearson correlation of r = 0.459 indicates a moderate positive association. More critically, the R² of 0.211 tells us that VIX levels explain only about 21% of the variance in Tape A share volume — meaning roughly 79% of volume variability is driven by other factors not captured here. The 95% confidence interval for r of [0.356, 0.551] is relatively tight given the sample size (n = 252), and the p-value of 1.58E-14 confirms this correlation is statistically highly significant and almost certainly not a chance artifact. Despite the strong statistical signal, the Granger causality tests complicate the picture considerably: neither direction shows significant predictive power (X→Y: F = 0.0014, p = 0.970; Y→X: F = 0.467, p = 0.495). This means that while VIX and volume are correlated contemporaneously, knowing yesterday's VIX does not meaningfully help predict today's volume, and vice versa — the relationship is associative but not temporally predictive at a one-period lag.
Notable Patterns, Clusters, and Outliers
The sample points reveal meaningful clustering and notable outliers. The majority of observations concentrate in the VIX range of roughly 220M–310M with VIX values between 12 and 20, forming a dense central cloud with moderate scatter. However, several high-leverage points are visible at elevated VIX readings — most notably the point near (401M, 36.02) and (387M, 28.03), which likely correspond to the August 2015 market volatility episode (the "Flash Crash" of August 24, 2015), when VIX spiked dramatically and volume surged simultaneously. These outliers exert disproportionate influence on the regression line and correlation coefficient. There also appear to be some observations with relatively high volume but modest VIX values, suggesting volume spikes can occur for reasons unrelated to fear-driven volatility.
Confounding Factors and Caveats
Several important caveats apply. First, the axis labels appear swapped based on the dataset descriptions — VIX close is listed on the X-axis from the volume dataset, and Tape A shares are on the Y-axis from the VIX dataset, which suggests a possible data labeling inconsistency worth verifying before drawing firm conclusions. Second, the moderate correlation may be substantially inflated by the August 2015 extreme volatility event; removing those outliers could materially reduce r. Third, seasonal patterns, options expiration cycles, and index rebalancing events all independently drive both VIX and volume, acting as common drivers that create correlation without direct causation. Finally, the lack of Granger causality suggests a common latent driver (e.g., macroeconomic news shocks, Federal Reserve communications) simultaneously influences both series rather than one causing the other.
Actionable Insights and Further Investigation
Practitioners should avoid using lagged VIX as a standalone predictor of next-day Tape A volume, given the failed Granger causality tests. Instead, investigation should focus on contemporaneous regime identification — classifying market days into low/medium/high volatility regimes and modeling volume behavior within each. It would be valuable to re-run the analysis excluding the August 2015 outlier cluster to assess how much of the correlation is event-driven. Extending the time series beyond a single calendar year would test whether this r ≈ 0.46 relationship is stable across different market environments. Finally, incorporating additional variables — such as put/call ratios, options expiration dates, or intraday volume distribution — into a multivariate model could substantially improve the 21% explained variance and yield more actionable trading or risk management insights.
X dataset: Cboe U.S. Equities Historical Market Volume Data 2015
Y dataset: VIX Daily Index
Part of experiment: Daily - Cboe U.S. Equities Historical Market Volume Data 2015 vs VIX Daily Index