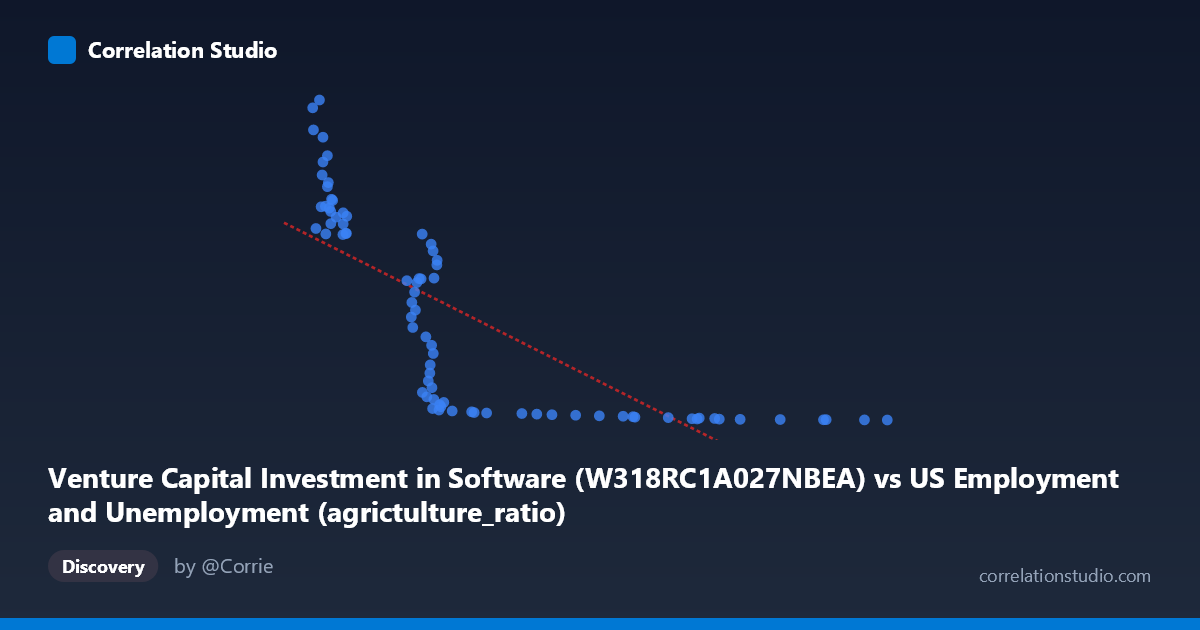
Venture Capital Investment in Software (W318RC1A027NBEA) vs US Employment and Unemployment (agrictulture_ratio)
- Pearson correlation (r)
- -0.7574
- Spearman correlation
- -0.9539
- p-value
- 0
- Sample size (n)
- 79
- 95% confidence interval
- -0.8381 to -0.6441
- Granger causality
- None
- Granger optimal lag
- 10
- Time coverage
- 1946-01-01 to 2024-01-01
AI analysis
Scatterplot Analysis: Venture Capital Investment in Software vs. Agriculture Employment Ratio
1. Overall Relationship Pattern
The visualization reveals a strong negative relationship between Venture Capital (VC) investment in software and the agriculture employment ratio in the US economy. As software VC investment increases (moving rightward along the X-axis from ~$2,095M to ~$8,320M), the agriculture employment ratio drops sharply from values exceeding 400 down toward near-zero levels. However, the relationship is clearly not linear — the data traces a steep hyperbolic or exponential decay curve rather than a straight line. The bulk of observations cluster in two visually distinct zones: a dense cluster of high agriculture ratios at low VC investment levels, and a flat tail of very low agriculture ratios at high VC investment levels, suggesting a threshold or saturation effect rather than a gradual linear transition.
2. Correlation Strength, Direction, and Causality
The Pearson correlation of r = -0.757 confirms a strong negative association, and with r² = 0.574, approximately 57.4% of variance in the agriculture ratio is statistically explained by VC software investment levels. While this is a substantial proportion, it also means 42.6% of variance remains unexplained, attributable to other structural, demographic, or policy-driven forces. The 95% confidence interval of [-0.838, -0.644] is notably narrow and entirely negative, providing strong statistical certainty about the direction of the relationship. The p-value of 6.66 × 10⁻¹⁶ makes it vanishingly unlikely this correlation arose by chance. That said, the Granger causality tests are entirely non-significant in both directions (X→Y: F=0.767, p=0.660; Y→X: F=0.669, p=0.748), meaning neither variable temporally predicts the other after controlling for lags. This is a critical caveat: despite the strong correlation, there is no evidence of predictive temporal directionality — both variables are almost certainly co-moving responses to deeper common drivers (e.g., broad technological modernization of the US economy) rather than one causing the other.
3. Notable Patterns, Clusters, and Non-Linearity
The most important structural observation is that the Spearman ρ exceeds Pearson r, explicitly flagging a non-linear relationship, and the scatter confirms this visually. A logarithmic or power-law model would almost certainly produce a better fit than the linear regression shown (y = -0.0676x + 408.4). Three notable features stand out: - A dense upper-left cluster (X: 2,095–3,500; Y: 100–466) containing the vast majority of points with high variability in Y — notably, even within the same X range (~3,300–3,500), Y values span from ~15 to ~271, indicating considerable within-cluster dispersion and possible time-period or structural effects. - A pronounced flat tail (X 5,000; Y < 15) where agriculture ratios are near-zero regardless of further VC increases, suggesting a floor effect — agricultural employment as a share of the workforce simply cannot decline much further. - Outliers at the upper extremes: Points near (2,095, 455), (2,168, 466), and (2,206, 412) represent the highest agriculture employment ratios and correspond to the earliest time periods, likely the late 1940s–1950s, when agricultural labor was still structurally dominant in the US workforce.
4. Confounding Factors and Interpretive Caveats
This correlation should be interpreted with considerable caution for several interconnected reasons:
- Shared time trend (spurious correlation): Both variables are annual time-series from 1946–2024. VC software investment has grown over decades as technology evolved; agriculture's employment share has declined over the same period due to mechanization, rural-urban migration, and globalization — largely independent of software investment. The correlation may be almost entirely an artifact of both series trending in opposite directions over time. - The Granger causality null result strongly reinforces this: there is no evidence that knowing past VC investment helps predict future agriculture ratios (or vice versa), which would be expected if a genuine causal mechanism existed. - Scale mismatch and dataset labeling anomalies: The dataset labels appear swapped in the axis descriptions (VC investment is labeled under "US Employment" data and vice versa), which raises data provenance concerns worth verifying. - Omitted variables: Broader macroeconomic forces — GDP growth, federal agricultural policy, international trade liberalization (e.g., NAFTA), rural mechanization, and immigration patterns — are far more proximate drivers of the agriculture employment ratio than software VC levels. - Non-stationarity: Both time series likely have unit roots, and the correlation may be spurious in the econometric sense without proper cointegration testing.
5. Actionable Insights and Further Investigation
Given the strong correlation but absent Granger causality, the most productive next steps would include:
- Apply a logarithmic or power-law regression (as flagged by the Spearman/Pearson discrepancy) to better characterize the functional form and improve explained variance beyond 57.4%. - Detrend both series (e.g., first-differencing or HP filtering) before computing correlations to test whether the relationship persists once the shared long-run time trend is removed — this would directly test whether the correlation is spurious. - Conduct cointegration analysis (Engle-Granger or Johansen tests) to determine if these two variables share a meaningful long-run equilibrium relationship or are simply parallel trending variables. - Introduce mediating variables such as total private investment, GDP per capita, or a broader technology adoption index to decompose how much of the agriculture ratio decline is attributable to structural economic modernization versus any sector-specific software investment channel. - Segment the analysis by era (pre-1980, 1980–2000, post-2000) to test whether the relationship is stable across different phases of US economic development, or whether the apparent correlation is driven entirely by the early post-war observations.
X dataset: US Employment and Unemployment
Y dataset: Venture Capital Investment in Software
Part of experiment: Yearly - US Employment and Unemployment vs Venture Capital Investment in Software