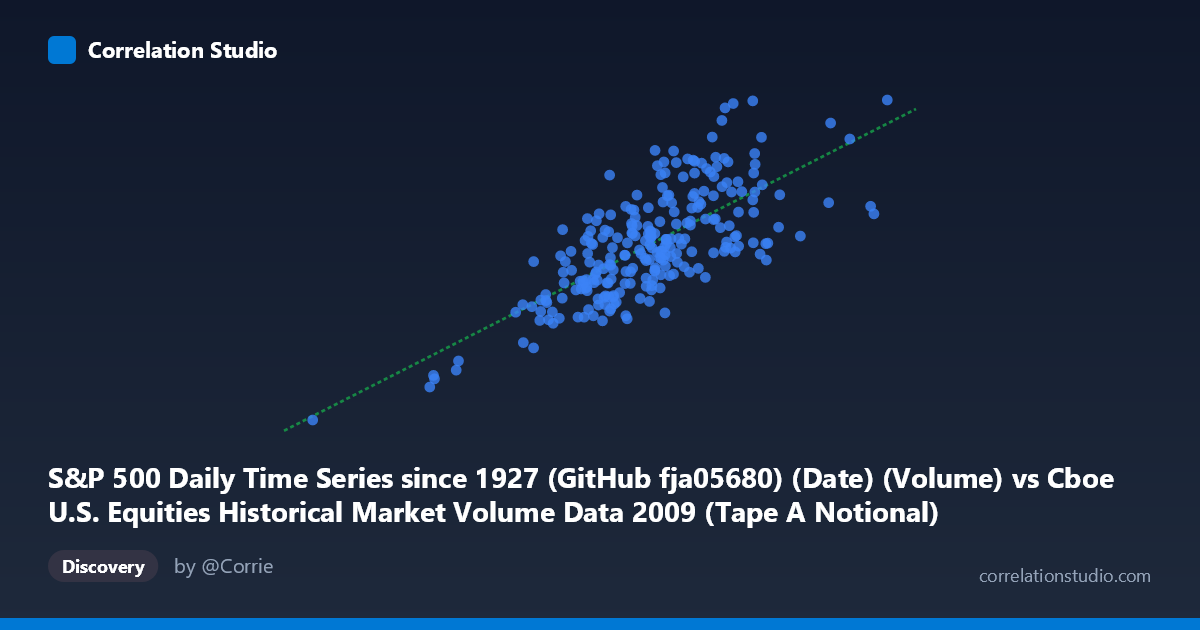
S&P 500 Daily Time Series since 1927 (GitHub fja05680) (Date) (Volume) vs Cboe U.S. Equities Historical Market Volume Data 2009 (Tape A Notional)
- Pearson correlation (r)
- 0.7256
- Spearman correlation
- 0.6987
- p-value
- 0
- Sample size (n)
- 252
- 95% confidence interval
- 0.6613 to 0.7793
- Granger causality
- X → Y
- Granger optimal lag
- 10
AI analysis
Scatterplot Analysis: S&P 500 Trading Volume vs. Cboe Tape A Notional Value (2009)
Relationship Overview
The scatterplot reveals a moderately strong positive relationship between S&P 500 daily trading volume (X-axis) and Cboe Tape A notional value (Y-axis) across 252 trading days in 2009. As daily trading volume increases, the notional dollar value of trades on Tape A rises correspondingly, which is intuitively coherent — more shares changing hands should, in general, translate to greater aggregate transaction value. The linear regression equation (y = 0.6713x − 2.405×10⁸) captures this upward trend, though the visible scatter around the regression line signals that volume alone is far from a complete explanation of notional value variation.
Correlation Strength and Statistical Significance
The Pearson correlation of r = 0.726 reflects a meaningful but imperfect association. The r² of 0.526 is the more practically important figure: roughly 52.6% of the variance in Tape A notional value is explained by trading volume, leaving nearly half the variation attributable to other factors. The 95% confidence interval of [0.661, 0.779] is relatively tight given the sample of 252 paired observations drawn from a population of 3,232, and the p-value of effectively zero confirms this relationship is not a statistical artifact. Crucially, the Granger causality analysis identifies a unidirectional predictive relationship — X Granger-causes Y at an optimal lag of 10 periods (F = 2.27, p = 0.015), while the reverse direction fails to reach significance (F = 0.73, p = 0.698). This means that lagged trading volume contains statistically useful information for forecasting Tape A notional value roughly two weeks ahead, but notional value does not similarly predict future volume. This is a practically meaningful asymmetry for short-horizon market analysis.
Notable Patterns, Clusters, and Outliers
Several structural features stand out in the data. The bulk of observations cluster in a central band roughly between 7–10 billion shares (X) and 4–7 billion dollars notional (Y), forming a relatively dense core. However, there are clear high-leverage outliers at both extremes: a point near (2.39B, 1.27B) sits in isolation at the lower-left, likely corresponding to an unusually quiet trading session early in 2009, while points near (13.08B, 9.12B) and (12.83B, 6.33B) anchor the upper range. The second of these two high-volume points is particularly notable — despite comparable or higher volume, its notional value is substantially lower than expected, suggesting a price-level divergence (i.e., high volume driven by lower-priced shares or instruments). A modest fan-shaped heteroscedasticity is also apparent, where variance in notional value widens at higher volume levels, hinting that the linear model may underfit the upper tail.
Confounding Factors and Interpretive Caveats
Several important caveats warrant caution. First, average share price is a direct confounder: notional value equals volume × price, so any day with elevated prices will inflate notional value independently of volume. The dramatic market volatility of 2009 — spanning the tail end of the financial crisis and the subsequent March recovery — means that price levels shifted substantially across the year, creating a time-varying confounder embedded in the data. Second, the Granger causality result, while statistically significant, does not imply economic causality in the structural sense; the 10-period lag relationship may be spuriously driven by shared autocorrelation structures in both series rather than a genuine mechanism. Third, Tape A covers only NYSE-listed securities, so the volume metric (which appears to span broader market activity) introduces a scope mismatch that could attenuate or distort the correlation. Finally, 2009 is a single, highly anomalous year, limiting the generalizability of these findings to other market regimes.
Actionable Insights and Further Investigation
Given that volume Granger-causes notional value at a 10-day lag, practitioners could explore whether lagged volume signals carry predictive value for liquidity and notional flow forecasting in near-term trading models, though this should be validated out-of-sample and across multiple years. To better isolate the volume–notional relationship, a natural next step is to partial out price-level effects by normalizing notional value by a contemporaneous price index, or by running the regression on log-transformed variables to stabilize heteroscedasticity. Investigating the outlier sessions — particularly the high-volume, lower-notional observations — could reveal whether certain market microstructure events (e.g., index rebalancing, expiration days, or crisis-driven retail activity in low-priced stocks) systematically decouple these two measures. Extending the analysis to multiple years would reveal whether the 10-period Granger lag is stable or regime-dependent, which is critical before acting on it operationally.
X dataset: Cboe U.S. Equities Historical Market Volume Data 2009
Y dataset: S&P 500 Daily Time Series since 1927 (GitHub fja05680) (Date)
Part of experiment: Daily - Cboe U.S. Equities Historical Market Volume Data 2009 vs S&P 500 Daily Time Series since 1927 (GitHub fja05680) (Date)