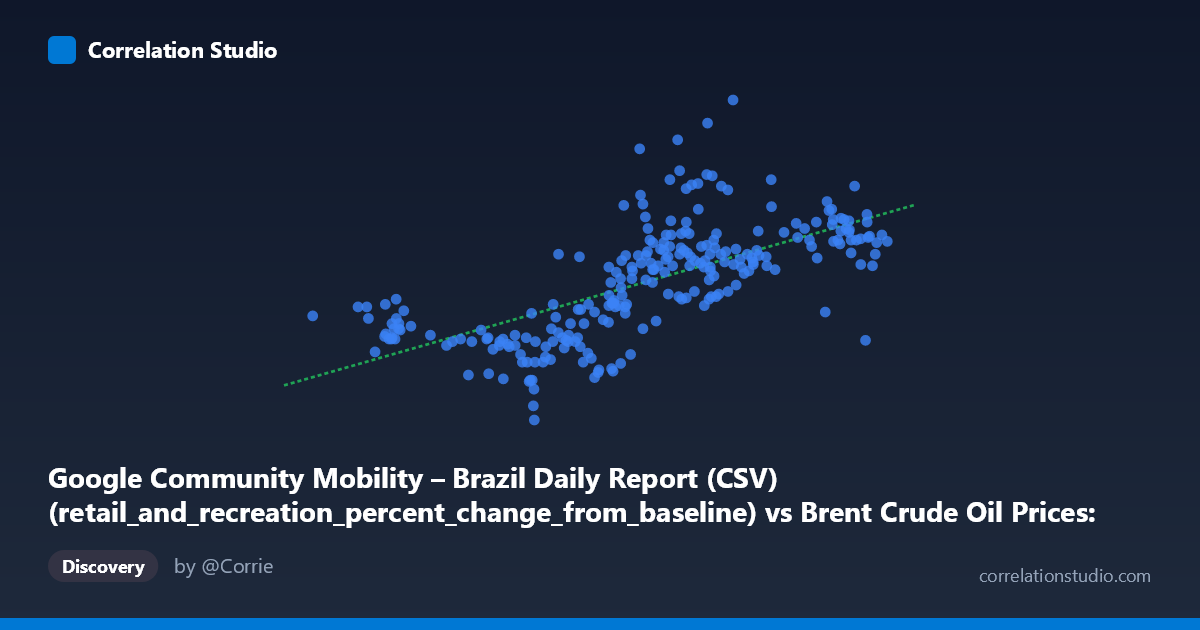
Google Community Mobility – Brazil Daily Report (CSV) (retail_and_recreation_percent_change_from_baseline) vs Brent Crude Oil Prices: Daily (DCOILBRENTEU) – FRED St. Louis Fed (DCOILBRENTEU)
- Pearson correlation (r)
- 0.6664
- Spearman correlation
- 0.7536
- p-value
- 0
- Sample size (n)
- 253
- 95% confidence interval
- 0.5917 to 0.7297
- Granger causality
- None
- Granger optimal lag
- 1
AI analysis
Analysis: Brent Crude Oil Prices vs. Brazil Retail & Recreation Mobility (2021)
1. Overall Relationship Pattern The scatterplot reveals a moderate positive linear relationship between Brent crude oil prices (X-axis) and Brazil's retail and recreation mobility changes from baseline (Y-axis) across 2021. As crude oil prices rise, Brazilian retail and recreation mobility tends to increase as well. The regression line (y = 1.20x − 95.58) cuts through a broadly dispersed cloud of points, suggesting the relationship is real but far from deterministic. The distribution of points shows that lower oil prices (roughly 50–65 USD/barrel) cluster predominantly in negative mobility territory, while higher prices (75–85 USD/barrel) are associated with mobility values spanning a wider, generally higher range.
2. Correlation Strength, Direction, and Temporal Causality The Pearson correlation of r = 0.667 indicates a moderate-to-strong positive association, statistically significant with a p-value effectively at zero across N = 1,095 observations. However, r² = 0.444 is the more sobering metric: only 44.4% of the variance in mobility is explained by oil prices, meaning the majority of mobility fluctuation is driven by other forces entirely. The 95% confidence interval of [0.592, 0.730] is relatively tight, confirming the correlation estimate is stable and not a statistical artifact. Critically, the Granger causality tests are non-significant in both directions (X→Y: F = 1.74, p = 0.189; Y→X: F = 0.015, p = 0.904), meaning neither variable temporally predicts the other at the optimal 1-period lag. This is a crucial caveat: the correlation is contemporaneous and associative, not evidence of any predictive or causal mechanism.
3. Notable Patterns, Clusters, and Outliers Several structural features stand out in the point cloud. There is a noticeable lower-left cluster of points concentrated around X = 50–65 and Y = −20 to −46, corresponding to early 2021 when both oil prices were depressed and Brazilian mobility remained suppressed — likely reflecting pandemic restrictions. A second, looser upper-right cluster emerges around X = 75–85 and Y = −5 to +20, consistent with mid-to-late 2021 recovery dynamics. One prominent outlier appears at approximately (64, −46), representing an unusually deep mobility suppression relative to its oil price level. Additionally, some points at high oil prices (80–85 USD) show negative or near-zero mobility, creating vertical spread at the upper end of the X range that weakens the linear fit and hints at heteroscedasticity.
4. Confounding Factors and Interpretive Caveats The correlation almost certainly reflects shared temporal confounding rather than any direct economic mechanism between crude prices and foot traffic in Brazilian retail venues. Both variables were jointly influenced by the trajectory of the COVID-19 pandemic throughout 2021: early-year lockdowns suppressed mobility while simultaneously coinciding with lower global oil demand and prices, and as vaccination rollout progressed, both mobility and economic activity (including energy demand) recovered together. This creates a spurious or at least heavily mediated relationship driven by a common third factor — pandemic progression — rather than a direct oil price → consumer behavior link. The axis label metadata also appears inverted in the dataset descriptions (each dataset's column is listed under the opposing dataset's name), which warrants data provenance verification before drawing firm conclusions. Seasonal effects, Brazilian holiday patterns, and regional heterogeneity across Brazilian states further complicate interpretation.
5. Actionable Insights and Further Investigation Given the absence of Granger causality, practitioners should not use oil prices as a leading indicator for Brazilian retail mobility forecasting, nor vice versa. Instead, the most productive next steps would be: (1) introduce pandemic-related control variables (vaccination rates, new case counts, restriction index scores) to partial out the shared COVID trajectory and test whether any residual oil-mobility correlation persists; (2) segment the time series into distinct pandemic phases (pre-vaccine, vaccine rollout, post-restriction) to test whether the correlation is uniformly present or concentrated in specific sub-periods; (3) examine lag structures beyond 1 period using a broader Granger framework, as economic transmission mechanisms between energy prices and consumer behavior can operate on weekly or monthly timescales; and (4) verify the dataset column assignments, as the apparent axis label swap in the metadata could indicate a data joining error that would invalidate all interpretation. Resolving that data quality issue should be the immediate first priority.
X dataset: Brent Crude Oil Prices: Daily (DCOILBRENTEU) – FRED St. Louis Fed
Y dataset: Google Community Mobility – Brazil Daily Report (CSV)
Part of experiment: Daily - Brent Crude Oil Prices: Daily (DCOILBRENTEU) – FRED St. Louis Fed vs Google Community Mobility – Brazil Daily Report (CSV)