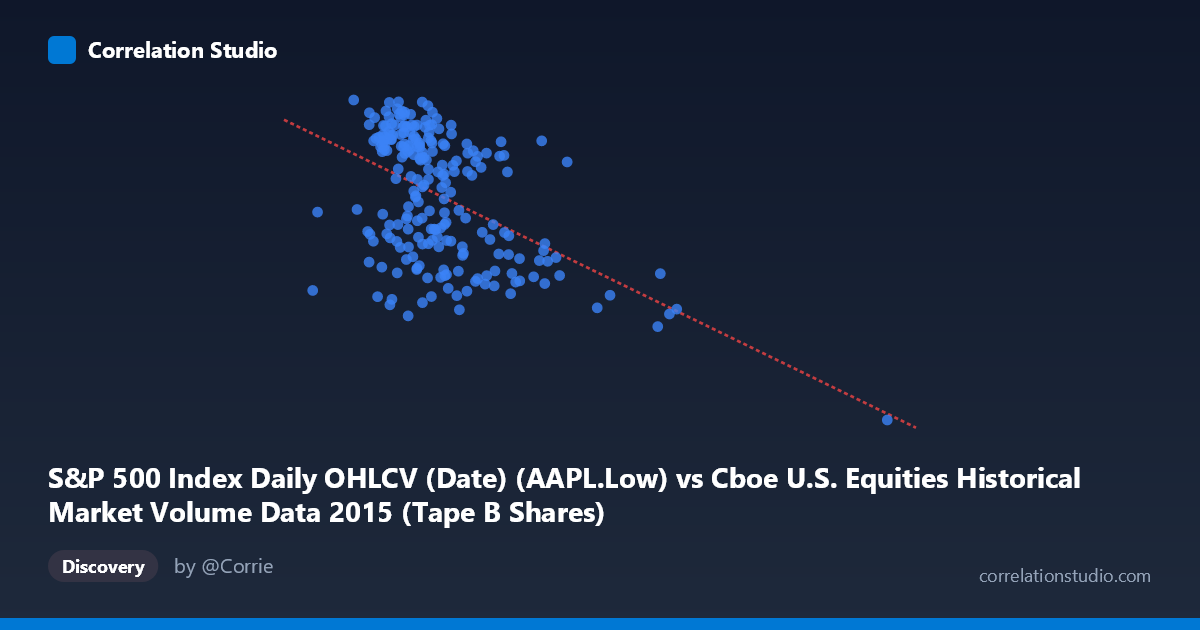
S&P 500 Index Daily OHLCV (Date) (AAPL.Low) vs Cboe U.S. Equities Historical Market Volume Data 2015 (Tape B Shares)
- Pearson correlation (r)
- -0.4957
- Spearman correlation
- -0.4444
- p-value
- 0
- Sample size (n)
- 222
- 95% confidence interval
- -0.5889 to -0.3894
- Granger causality
- None
- Granger optimal lag
- 1
AI analysis
Analysis: AAPL Low Price vs. Cboe Tape B Share Volume (2015)
Relationship Overview The scatterplot reveals a negative relationship between Apple's daily low price (X-axis) and Cboe Tape B share volume (Y-axis) over the 2015 trading year. As AAPL's low price increases, Tape B share volume tends to decrease, and the linear regression equation (y = -1.288×10⁻⁷x + 132.94) quantifies this inverse trend. This pattern is visually consistent across the bulk of the data, though with considerable scatter, suggesting the relationship is real but far from deterministic. The data spans roughly 10 months of daily observations, providing a reasonable temporal window for identifying structural patterns.
Correlation Strength and Statistical Significance The Pearson correlation of r = -0.496 indicates a moderate negative relationship, but the more informative statistic is r² = 0.246 — meaning only about 24.6% of the variance in Tape B share volume is explained by AAPL's low price. The remaining ~75% is driven by other factors entirely. The 95% confidence interval of [-0.589, -0.389] is reasonably narrow and lies entirely in negative territory, confirming the direction is robust. The p-value of 3.55×10⁻¹⁵ makes it statistically unambiguous that the correlation is not a sampling artifact. However, the Granger causality tests are both non-significant (X→Y: F=0.368, p=0.545; Y→X: F=0.765, p=0.383), meaning neither variable temporally predicts the other at a 1-period lag. This is a critical finding: whatever correlation exists appears contemporaneous or spurious, not mechanistically directional in time.
Notable Patterns, Clusters, and Outliers The data reveals two visually distinct features. First, there is a dense central cluster roughly between AAPL lows of $75M–$135M and Tape B volumes of 110–130, where most observations concentrate. Second, there are clear outliers at the upper-right and lower-right extremes: most notably the point near (311,969,106, 92.00) — an extreme high-X, low-Y observation that sits far from the main cluster and likely exerts disproportionate leverage on the regression slope. Several other points in the $150M–$205M X range also exhibit notably lower Y values, reinforcing the negative trend but hinting at possible non-linearity or threshold effects, where volume suppression accelerates at higher price levels.
Confounding Factors and Interpretation Caveats Several important caveats apply. First, the axes appear swapped in the dataset labeling — the X variable is labeled as coming from a "Market Volume" dataset but contains what appears to be price data (AAPL Low), while the Y variable is from an S&P 500 OHLCV dataset but contains share volume. This metadata inconsistency warrants verification before drawing firm conclusions. Second, 2015 was a notably volatile year for markets (August correction, China slowdown fears), meaning both AAPL price declines and volume spikes may be jointly driven by macro risk-off events, creating a spurious or confounded correlation. Third, the relationship could reflect a size/liquidity dynamic: when AAPL trades at lower prices, retail participation and overall market breadth may shift volume patterns on Tape B exchanges. Seasonality and day-of-week effects are also uncontrolled.
Actionable Insights and Further Investigation Given the moderate but unexplained variance and absent Granger causality, this correlation should not be used for predictive modeling in its current form. Recommended next steps include: (1) controlling for market-wide volatility (VIX) and volume as confounders to test whether the relationship survives; (2) segmenting the data by market regime (pre/post August 2015 correction) to check for structural breaks; (3) investigating the extreme outlier near X=312M to determine if it represents a data error, stock split artifact, or genuine market event; and (4) testing non-linear models (log transformation, piecewise regression) given the visual clustering pattern. The absence of Granger causality also suggests that cross-sectional rather than time-series analysis may be a more appropriate framework for understanding this relationship.
X dataset: Cboe U.S. Equities Historical Market Volume Data 2015
Y dataset: S&P 500 Index Daily OHLCV (Date)
Part of experiment: Daily - Cboe U.S. Equities Historical Market Volume Data 2015 vs S&P 500 Index Daily OHLCV (Date)