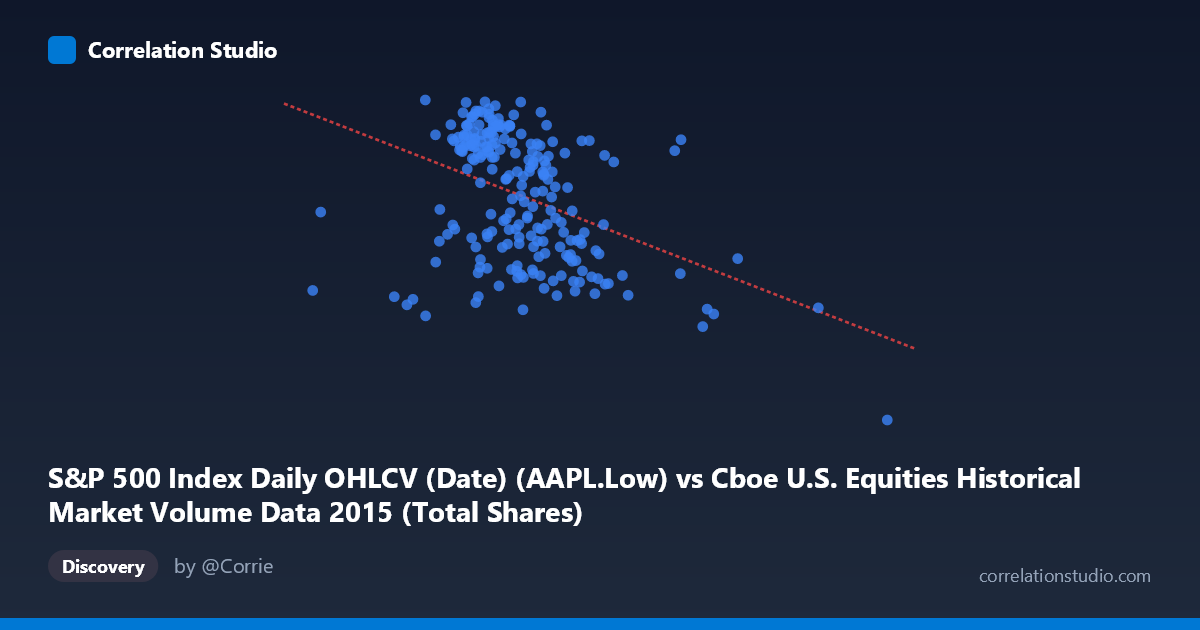
S&P 500 Index Daily OHLCV (Date) (AAPL.Low) vs Cboe U.S. Equities Historical Market Volume Data 2015 (Total Shares)
- Pearson correlation (r)
- -0.4051
- Spearman correlation
- -0.4176
- p-value
- 0
- Sample size (n)
- 222
- 95% confidence interval
- -0.5096 to -0.2888
- Granger causality
- None
- Granger optimal lag
- 1
AI analysis
Scatterplot Analysis: AAPL Low Price vs. Cboe Total Shares Volume (2015)
Relationship Overview The scatterplot reveals a negative relationship between Apple's daily low price (X-axis) and total U.S. equities shares traded on Cboe exchanges (Y-axis) across 2015. As AAPL's low price increases, total market share volume tends to decrease, and vice versa. The linear regression equation (y = -3.10438E-08x + 136.023) confirms this downward slope, though the scatter around the regression line is substantial, indicating the relationship is real but far from deterministic. The data cluster predominantly in the AAPL low price range of ~$420–$650, with most total shares values falling between roughly 105 and 131, suggesting a relatively stable core trading environment punctuated by notable exceptions.
Correlation Strength and Statistical Significance The correlation coefficient of r = -0.4051 indicates a moderate negative association, but the more practically informative metric is r² = 0.1641 — meaning AAPL's low price explains only about 16.4% of the variance in total Cboe shares traded. The remaining ~83.6% is driven by other factors entirely. The 95% confidence interval of [-0.5096, -0.2888] is comfortably negative and does not cross zero, and the p-value of 3.55E-10 confirms this correlation is highly statistically significant — unlikely to be a chance finding given n = 222. However, statistical significance should not be conflated with practical importance: a 16% variance explanation is modest at best. Critically, the Granger causality tests are non-significant in both directions (X→Y: F = 0.1555, p = 0.6937; Y→X: F = 0.0005, p = 0.9830), meaning neither variable temporally predicts the other at a one-period lag. This effectively rules out a simple lead-lag causal mechanism and suggests the observed correlation reflects concurrent co-movement rather than directional influence.
Notable Patterns, Clusters, and Outliers Several features stand out visually. The bulk of observations form a loose negative-sloping cloud concentrated between X = ~$420M–$640M (representing AAPL low prices in the mid-$400s to low-$600s range) and Y = ~108–131 total shares. There are at least two prominent outliers worth flagging: the point at approximately (1,092,406,681, 92.00) sits far to the right and at the lowest Y value in the dataset — a clear extreme that likely corresponds to a specific high-volatility market event — and a point near (808,155,543, 103.50) that similarly sits in low-volume, high-X territory. There also appears to be a small isolated cluster at very low X values (~$207M–$350M range), including the point near (219,657,168, 117.60) and (352,410,686, 106.18), which diverge from the main cluster and may represent early 2015 data or anomalous trading sessions. These outliers likely exert disproportionate influence on the regression slope and correlation coefficient.
Confounding Factors and Interpretive Caveats Several important caveats apply here. First, the axis labels appear swapped in context: the X variable is labeled as coming from the Cboe volume dataset but contains AAPL price data, while the Y variable is from the S&P 500 OHLCV dataset but contains total shares volume — suggesting a dataset join or labeling inconsistency that warrants verification before drawing firm conclusions. Second, the negative correlation likely reflects a broader 2015 market narrative: AAPL experienced price pressure through mid-to-late 2015 (particularly during the August 2015 market correction), during which overall trading volumes surged — a pattern common in sell-offs where prices fall and volume spikes. This means the correlation may be driven largely by a few high-stress market episodes rather than a stable structural relationship. Third, total Cboe shares traded is a market-wide aggregate, making it susceptible to macroeconomic shocks, regulatory events, and index rebalancing that have no direct connection to AAPL's price level.
Actionable Insights and Further Investigation Given the moderate but statistically robust correlation and the absence of Granger causality, the most productive next steps would be to: (1) verify dataset column assignments to ensure X and Y are correctly aligned; (2) investigate the extreme outlier near X = 1.09B, as it may represent a data error or a singular event (e.g., an options expiration or earnings day) that disproportionately skews results; (3) perform a segmented analysis separating the calm trading period (Q1–Q2 2015) from the volatile August–September 2015 correction to test whether the correlation holds across regimes or is regime-dependent; (4) introduce control variables such as VIX (volatility index), broad market returns, or trading day type (options expiry, end-of-quarter) to isolate whether the AAPL-volume relationship persists after accounting for market-wide stress; and (5) explore non-linear modeling (e.g., a piecewise or polynomial fit) given the visual suggestion that the relationship may steepen at extreme X values.
X dataset: Cboe U.S. Equities Historical Market Volume Data 2015
Y dataset: S&P 500 Index Daily OHLCV (Date)
Part of experiment: Daily - Cboe U.S. Equities Historical Market Volume Data 2015 vs S&P 500 Index Daily OHLCV (Date)