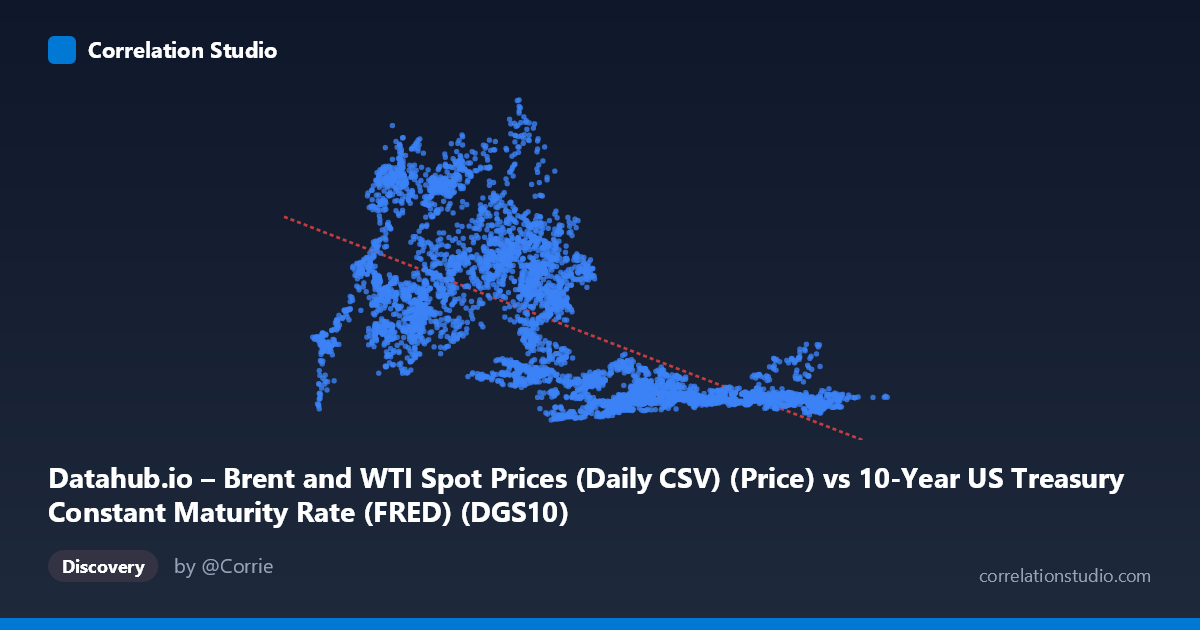
Datahub.io – Brent and WTI Spot Prices (Daily CSV) (Price) vs 10-Year US Treasury Constant Maturity Rate (FRED) (DGS10)
- Pearson correlation (r)
- -0.657
- Spearman correlation
- -0.709
- p-value
- 0
- Sample size (n)
- 9642
- 95% confidence interval
- -0.6682 to -0.6455
- Granger causality
- None
- Granger optimal lag
- 1
AI analysis
Analysis: Brent Crude Oil Prices vs. 10-Year US Treasury Yield
Relationship Overview
The scatterplot reveals a moderate negative relationship between the 10-year US Treasury yield (X-axis) and Brent crude oil spot prices (Y-axis), with the linear regression equation y = -9.68x + 95.13 suggesting that for each percentage point increase in the 10-year yield, oil prices decline by approximately $9.68 per barrel on average. Visually, the data shows a clear downward trend: when Treasury yields are low (roughly 1–3%), oil prices span a wide range including many high values ($60–$144/barrel), while at higher yields (7–10%), prices cluster tightly at lower levels ($10–$30/barrel). This pattern is consistent with the broad economic narrative that low-rate environments tend to coincide with periods of monetary stimulus and dollar weakness that support commodity prices, while high-rate regimes reflect tighter conditions that historically suppressed oil demand and prices.
Correlation Strength and Statistical Significance
The correlation coefficient of r = -0.657 indicates a moderate-to-strong negative linear association, and the r² of 0.432 means that approximately 43% of the variance in Brent crude prices is explained by the 10-year Treasury yield — a meaningful but far from complete explanation. The 95% confidence interval of [-0.668, -0.646] is remarkably tight given the large sample (n = 9,642), and the p-value of effectively zero confirms this relationship is statistically indistinguishable from chance. However, statistical significance here is partly a function of sample size — with nearly 10,000 paired observations spanning 1987–2026, even modest effects would achieve significance. The remaining 57% of variance is unexplained, pointing to substantial other drivers. Critically, the Granger causality tests show no significant predictive directionality in either direction (X→Y: F = 0.52, p = 0.47; Y→X: F = 1.34, p = 0.25), meaning that past values of Treasury yields do not statistically predict future oil prices, and vice versa, at a one-period lag. This is a crucial caveat: the correlation reflects a contemporaneous association, not a temporal lead-lag relationship, and should not be interpreted as evidence of predictive or causal linkage.
Notable Patterns, Clusters, and Outliers
Several structural features stand out in the data. At high yield levels (7–10%, corresponding roughly to the late 1980s and early 1990s), oil prices are compressed into a narrow band of approximately $10–$35/barrel, forming a dense, well-behaved cluster with low variance. At low yield levels (1–4%), the scatter fans out dramatically, with oil prices ranging from under $20 to nearly $144/barrel — a heteroscedastic pattern (variance increasing as X decreases) that violates a key assumption of ordinary least squares regression. Several notable outliers appear in the low-yield region: points such as (1.96, 119.30), (1.61, 110.06), and (1.98, 124.89) represent extreme oil price spikes during low-rate periods (likely 2008 pre-crisis peak or 2022 post-COVID surge), while points like (4.28, 70.01) and (5.09, 71.36) show elevated prices even at moderate yields. Conversely, the cluster of points near (5–9, 15–20) suggests an era of structurally low oil prices despite varying rates. This fan-shaped dispersion strongly suggests a non-linear or regime-dependent relationship that a single linear model inadequately captures.
Confounding Factors and Interpretive Caveats
The correlation almost certainly reflects shared temporal trends rather than a direct causal mechanism. Both variables are strongly influenced by macroeconomic regime changes: the high-yield/low-oil era of the late 1980s–1990s reflects post-Volcker monetary tightening and the oil glut; the low-yield/high-oil era of the 2000s–2010s reflects post-2008 quantitative easing alongside OPEC supply discipline and emerging market demand growth; and the recent low-yield/collapsed-oil episode of 2020 reflects the COVID-19 demand shock. Confounders include the US dollar index (a common driver of both yields and oil prices), global growth cycles, OPEC+ production decisions, geopolitical shocks (Gulf Wars, Russia-Ukraine), Federal Reserve policy regimes, and structural shifts in US shale production. The absence of Granger causality further reinforces that the apparent correlation is largely spurious co-movement driven by underlying macro cycles rather than a reliable predictive relationship. The heteroscedasticity also means standard errors and confidence intervals from linear regression may be underestimated.
Actionable Insights and Further Investigation
Practitioners should avoid using Treasury yields alone as a predictive signal for oil prices given the failed Granger causality tests and the vast unexplained variance. Several analytical extensions would add value. First, segmenting the data by monetary policy regime (tightening vs. easing cycles) or decade would likely reveal structurally different sub-relationships and reduce the apparent heteroscedasticity. Second, a non-linear model (polynomial, spline, or log-transformed) would better capture the fan-shaped dispersion at low yields. Third, incorporating additional covariates — particularly the DXY dollar index, global PMI, OPEC spare capacity, and US inventory levels — in a multivariate framework would substantially improve explanatory power beyond the current 43%. Fourth, testing Granger causality at multiple lags (not just lag-1) could reveal slower-acting relationships that a one-period lag misses. Finally, given the 39-year time span, a rolling correlation analysis would illuminate whether this relationship strengthens or reverses across different macro environments — critical information for any investment or policy application.
X dataset: 10-Year US Treasury Constant Maturity Rate (FRED)
Y dataset: Datahub.io – Brent and WTI Spot Prices (Daily CSV)
Part of experiment: Daily - 10-Year US Treasury Constant Maturity Rate (FRED) vs Datahub.io – Brent and WTI Spot Prices (Daily CSV)