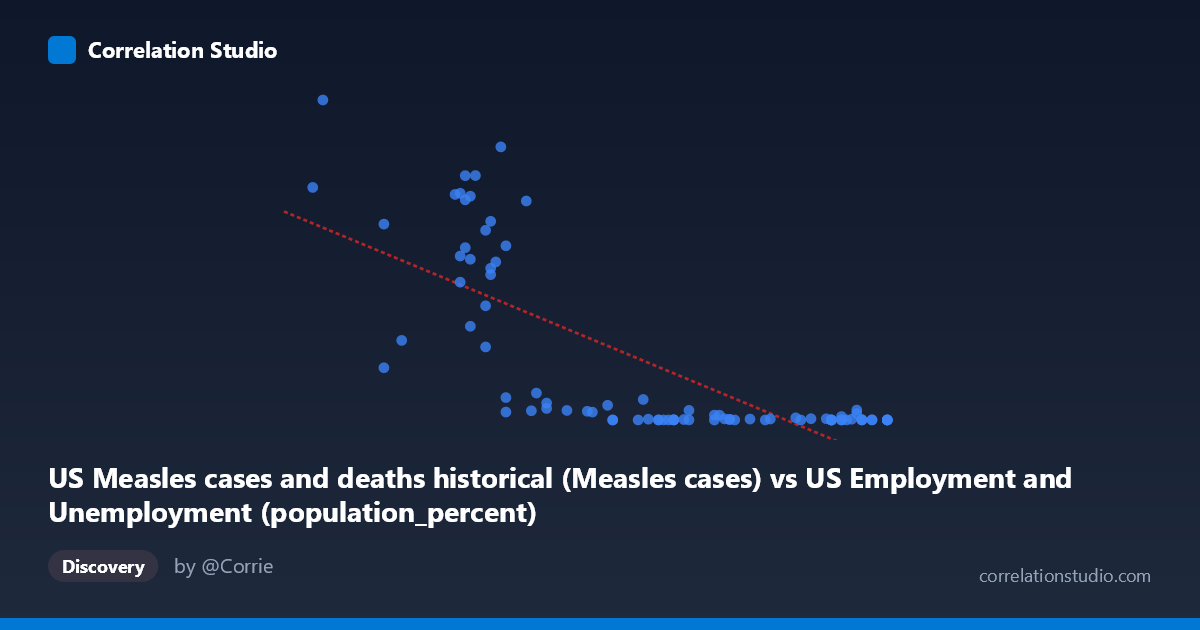
US Measles cases and deaths historical (Measles cases) vs US Employment and Unemployment (population_percent)
- Pearson correlation (r)
- -0.7514
- Spearman correlation
- -0.7808
- p-value
- 0
- Sample size (n)
- 85
- 95% confidence interval
- -0.8314 to -0.6409
- Granger causality
- None
- Granger optimal lag
- 10
- Time coverage
- 1941-01-01 to 2025-01-01
- Recomputed on refreshed data
- 2026-10-17 (r was -0.7514)
AI analysis
Analysis: US Measles Cases vs. Employment Population Percent
Overview of the Relationship
The scatterplot reveals a strong negative association between US measles cases and the employment population percentage, with higher measles case counts clustering at lower employment percentages (roughly 55.8–61) and dramatically lower case counts appearing at higher employment percentages (63–67). The relationship is visually striking but clearly non-linear — the data shows a sharp, exponential-like decay rather than the straight line implied by the linear regression model. This curvilinear pattern is one of the most important features of the chart and suggests that a linear fit, while capturing the broad trend, substantially misrepresents the underlying structure of the data.
Correlation Strength and Statistical Significance
The Pearson correlation of r = -0.7514 indicates a strong negative correlation, and the linear model explains r² = 56.5% of the variance in employment population percentage — a meaningful but far from complete account of the relationship. The 95% confidence interval of [-0.8314, -0.6409] is reasonably tight and entirely negative, confirming the direction is consistent, and the p-value of 2.22E-16 makes it statistically indistinguishable from zero under a null hypothesis of no correlation. However, the remaining ~43.5% of unexplained variance is substantial, and the non-linear visual pattern suggests that even a stronger non-linear model (e.g., logarithmic or exponential) would better capture the structure. Critically, the Granger causality results show no significant predictive direction in either direction (X→Y: F=0.981, p=0.471; Y→X: F=0.884, p=0.553), meaning that neither variable temporally predicts the other at the optimal 10-period lag. This is a crucial caveat: despite the strong correlation, there is no detectable causal temporal signal between the two series.
Notable Patterns, Clusters, and Outliers
The data naturally partitions into two visually distinct regimes. A high-density cluster of large Y-values (100,000–894,134 measles cases) is concentrated at X values between roughly 55.8 and 61.5, representing the pre-vaccine era (1940s–1960s) when both measles was rampant and employment population ratios were lower. A second tight cluster of near-zero Y-values (under ~30,000) spans X values from about 62 to 67.1, representing the post-vaccine modern era. Several specific outliers deserve attention: the point (56.0, 894,134) is the highest measles case count and sits at the lowest employment percentage, anchoring the upper-left extreme. Conversely, points like (67.1, 85–141) anchor the lower-right. The point (57.55, 222,375) and (66.5, 17,914) and (66.5, 27,808) appear somewhat anomalous within their local clusters, suggesting years with unusual labor market or epidemiological dynamics. The extreme spread in Y (range: 13 to 894,134; stdev: 248,233) relative to the tighter X range (55.8–67.1; stdev: 3.16) further highlights how Y is doing most of the visual "work" in the correlation.
Confounding Factors and Interpretation Caveats
This correlation is almost certainly a classic case of shared temporal trend confounding, not a mechanistic relationship. Both variables changed dramatically over the same historical period (1941–2025) for entirely independent reasons: measles cases collapsed following the introduction of the measles vaccine in 1963 and subsequent immunization campaigns, while employment population percentages rose due to post-WWII economic expansion, increased female labor force participation, and demographic shifts. These are parallel secular trends — both driven by time — rather than causally linked phenomena. The Granger causality result strongly reinforces this interpretation: neither series predicts the other after accounting for their own histories. Additionally, the Y-axis label assignment appears swapped in the dataset metadata (measles cases described as employment data and vice versa), which warrants verification before any formal reporting. The non-linearity also means the linear regression coefficients (-59,000.9 slope, intercept ~3.84M) should not be used for prediction or policy inference.
Actionable Insights and Further Investigation
The most productive next step would be to explicitly model time as the primary variable — regressing both measles cases and employment percentage on year — and then test whether any residual correlation remains after removing the shared time trend. A log transformation of Y (measles cases) would linearize the apparent exponential decay and produce a more statistically appropriate model. It would also be valuable to introduce the 1963 vaccine introduction as a structural break variable to test whether the relationship differs meaningfully in pre- versus post-vaccine eras. Researchers might also explore whether socioeconomic proxies (poverty rates, urban density, healthcare access) mediate any residual association. Finally, replicating this analysis at a state or county level with cross-sectional data — where the time-trend confound is removed — would provide a much stronger test of whether employment conditions genuinely relate to measles transmission dynamics through mechanisms such as crowding, healthcare access, or vaccine uptake.
X dataset: US Employment and Unemployment
Y dataset: US Measles cases and deaths historical
Part of experiment: Yearly - US Employment and Unemployment vs US Measles cases and deaths historical