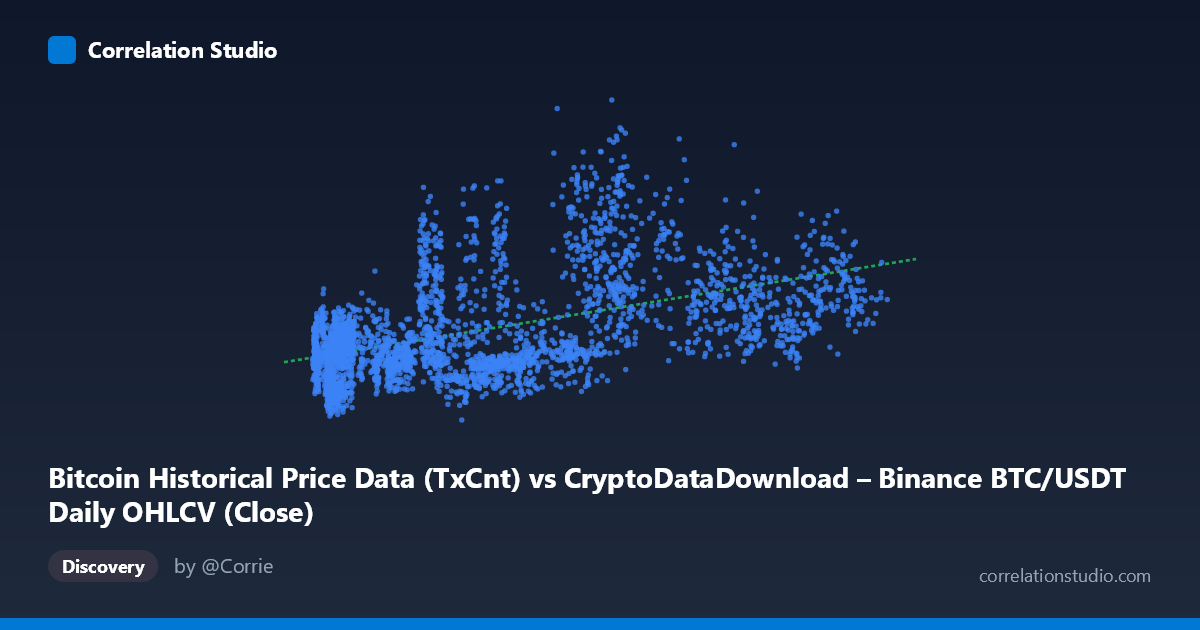
Bitcoin Historical Price Data (TxCnt) vs CryptoDataDownload – Binance BTC/USDT Daily OHLCV (Close)
- Pearson correlation (r)
- 0.5026
- Spearman correlation
- 0.5058
- p-value
- 0
- Sample size (n)
- 3191
- 95% confidence interval
- 0.4762 to 0.5281
- Granger causality
- None
- Granger optimal lag
- 10
AI analysis
Analysis: Bitcoin Transaction Count vs. Close Price
1. What the Visualization Reveals
The scatterplot shows a moderate positive association between Bitcoin's daily transaction count (X) and its closing price (Y). Points are widely scattered around the fitted regression line (y = 1.94x + 274,791), forming a diffuse cloud rather than a tight linear band. This indicates that while higher transaction counts tend to co-occur with higher prices on average, the relationship is loose and noisy — many low-TxCnt days show prices ranging from ~130,000 to over 400,000, and similarly high-TxCnt days span a wide price range (e.g., points near X=80,000-110,000 show Y values from ~412,000 to ~597,000).
2. Strength, Direction, and Statistical Confidence
The correlation coefficient (r = 0.50) reflects a moderate positive relationship, but r² = 0.253 means only about 25% of the variance in price is explained by transaction count — leaving roughly 75% attributable to other factors. The 95% CI [0.476, 0.528] is fairly narrow given the large sample (n=3,191), and the p-value ≈ 0 confirms this correlation is highly statistically significant — it's very unlikely to be due to chance. However, statistical significance here reflects sample size more than practical strength; a large n can detect weak-to-moderate effects reliably. Critically, the Granger causality tests show no significant predictive direction in either direction (X→Y: p=0.622; Y→X: p=0.881). This means neither variable helps forecast the other's future values based on past patterns — the correlation is likely contemporaneous/structural (both driven by common market dynamics) rather than one causing or leading the other over time.
3. Notable Patterns and Outliers
Several features stand out: a dense cluster of low-TxCnt (X < 15,000) points with prices concentrated between 130,000–400,000, suggesting periods of low network activity coinciding with lower-to-moderate prices. Notable outliers include (42,283, 724,837) and (26,623, 492,845) — mid-range transaction counts paired with disproportionately high prices, likely reflecting periods where price surged due to speculative demand without proportional on-chain activity (e.g., driven by derivatives/exchange trading rather than base-layer usage). The scatter also shows heteroscedasticity — variance in Y appears to increase at both very low and very high X values, suggesting the relationship may not be well-captured by a simple linear model across the full range.
4. Confounding Factors and Caveats
Several confounders likely dilute this relationship. TxCnt is a supply-side/network usage metric, while Close price is driven heavily by macro sentiment, exchange liquidity, derivatives markets, regulatory news, and broader crypto-market cycles — factors uncorrelated with raw transaction throughput. The 2017–2026 time span covers multiple distinct market regimes (2017 bull run, 2018-2019 bear market, 2020-2021 bull run, subsequent cycles), and pooling these regimes into a single correlation can create spurious or diluted relationships (Simpson's paradox risk) — the true within-regime correlation could be stronger or weaker. Additionally, transaction count is affected by non-price factors like SegWit adoption, batching practices by exchanges, and Lightning Network offloading, which changed on-chain behavior independent of price.
5. Actionable Insights
Given the lack of Granger causality, this pair should not be used for lead-lag trading signals in its current form. Recommended next steps: (1) segment the analysis by market regime/year to check if correlation strength is time-varying; (2) test transformed variables (log-log regression) since both series are right-skewed, which may better capture the true relationship and improve fit; (3) incorporate additional on-chain metrics (active addresses, hash rate, exchange inflows) as covariates to isolate TxCnt's marginal explanatory power; and (4) investigate the high-price/moderate-TxCnt outliers directly to identify whether they cluster around specific known market events (e.g., ETF approvals, halving cycles).
X dataset: CryptoDataDownload – Binance BTC/USDT Daily OHLCV
Y dataset: Bitcoin Historical Price Data
Part of experiment: Bitcoin - CryptoDataDownload – Binance BTC/USDT Daily OHLCV vs Bitcoin Historical Price Data