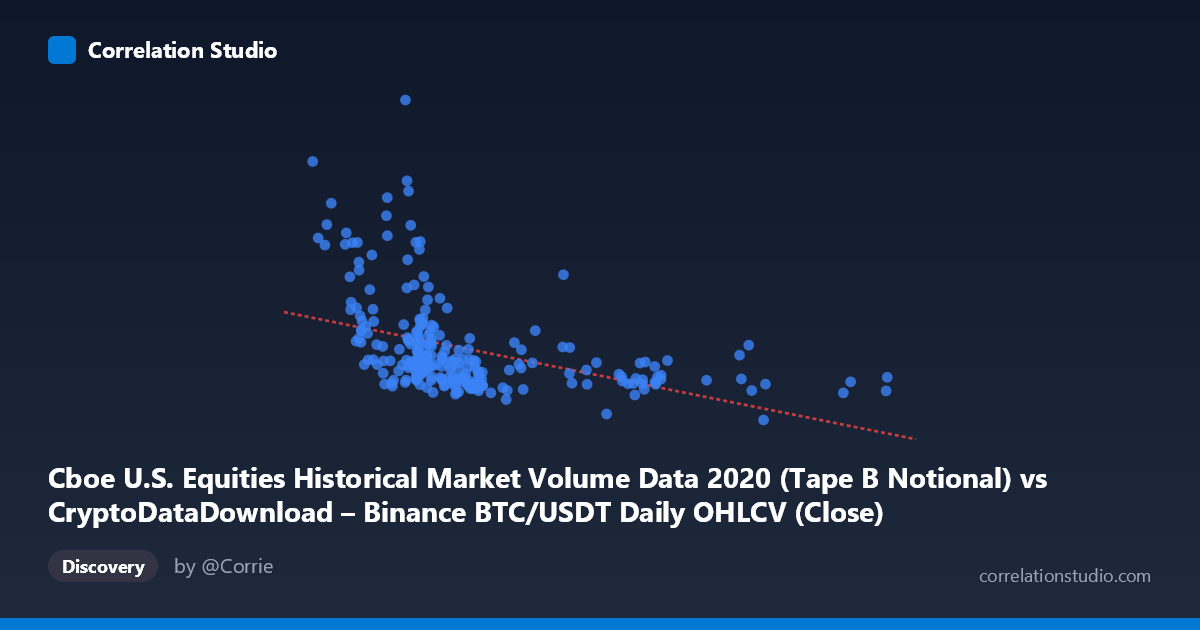
Cboe U.S. Equities Historical Market Volume Data 2020 (Tape B Notional) vs CryptoDataDownload – Binance BTC/USDT Daily OHLCV (Close)
- Pearson correlation (r)
- -0.43
- Spearman correlation
- -0.6067
- p-value
- 0
- Sample size (n)
- 253
- 95% confidence interval
- -0.5254 to -0.3238
- Granger causality
- None
- Granger optimal lag
- 10
AI analysis
Analysis: Cboe Equities Volume vs. BTC/USDT Close Price (2020)
1. What the Visualization Reveals
The scatterplot shows a modest negative relationship between U.S. equities market notional volume (X-axis) and Bitcoin's closing price (Y-axis) throughout 2020. The data cloud is diffuse rather than tightly linear — most points cluster in the X range of 7,000–12,000 with Y values scattered widely between roughly $3.8B and $10B, while a smaller number of high-X observations (17,000–29,000) correspond consistently to low, tightly-clustered Y values (~$3.8–5.4B). This creates an asymmetric, fan-shaped pattern rather than a clean linear trend.
2. Strength, Direction, and Statistical Confidence
The Pearson correlation (r = -0.43) indicates a moderate negative relationship, with R² = 0.185 meaning equities volume explains only about 18.5% of the variance in BTC price — leaving over 80% attributable to other factors. The 95% CI [-0.525, -0.324] is reasonably tight and excludes zero, and the p-value (8.3E-13) confirms this correlation is highly unlikely to be due to chance in this sample. However, statistical significance here reflects sample size and consistency, not necessarily practical importance — a correlation this size has limited predictive utility on its own. Critically, the Granger causality tests show no significant predictive direction in either direction (X→Y p=0.75; Y→X p=0.35), meaning past values of one series do not meaningfully forecast future values of the other. This suggests the contemporaneous correlation may be driven by shared external factors (e.g., both markets reacting to the same macro shocks) rather than one variable causally leading the other.
3. Notable Patterns and Outliers
Several features stand out: - A high-leverage outlier: (8692.91, $21.2B) is far above the rest of the data and likely corresponds to a single extreme volume day (possibly March 2020 COVID crash volatility), which could be inflating the magnitude of the correlation. - Two loose regimes: a dense, high-variance cluster at lower X values (equities volume 7,000–12,000) with BTC prices swinging from ~$3.8B to over $15B, and a sparser, low-variance cluster at higher X (17,000+) where BTC price is compressed near $4–5.4B. - Non-linearity flagged: The note that Spearman ρ exceeds Pearson r suggests the relationship isn't well-captured by a straight line — potentially a curved or threshold-type relationship, where BTC price only drops consistently once equities volume crosses a certain threshold (~15,000+), but shows no clear pattern below that.
4. Confounding Factors and Caveats
2020 was dominated by the COVID-19 market crash and subsequent recovery — a period of extreme, correlated volatility across nearly all asset classes. Both equities trading volume and BTC price likely responded to the same macro drivers (Fed policy, liquidity crises, stimulus, risk-on/risk-off sentiment) rather than one causing the other. This is a classic case of spurious or confounded correlation via a common third factor (market-wide volatility/fear). Additionally, using notional dollar volume conflates price and share-count effects, and the units/scales of the two series are vastly different, making the regression coefficient (-288,114) hard to interpret economically. The single extreme outlier and non-normality of price data (BTC ranged 5x within the year) further complicate a simple Pearson-based interpretation.
5. Suggestions for Further Investigation
1. Remove/winsorize the extreme outlier and re-run correlation and regression to test sensitivity. 2. Test non-linear models (log-log, polynomial, or spline regression) given the Spearman/Pearson divergence. 3. Control for time/volatility regime — segment data into pre-COVID, COVID-crash, and recovery periods to see if the relationship is driven by a specific window rather than persisting all year. 4. Add a third variable (e.g., VIX, overall market volatility index, or Fed policy indicators) to test whether it explains both series simultaneously, clarifying whether the BTC–equities link is direct or mediated. 5. Given the lack of Granger causality, avoid using one series to forecast the other in a trading or risk model; instead, treat both as co-moving with a shared macro driver rather than a causal pair.
X dataset: CryptoDataDownload – Binance BTC/USDT Daily OHLCV
Y dataset: Cboe U.S. Equities Historical Market Volume Data 2020
Part of experiment: Bitcoin - CryptoDataDownload – Binance BTC/USDT Daily OHLCV vs Cboe U.S. Equities Historical Market Volume Data 2020