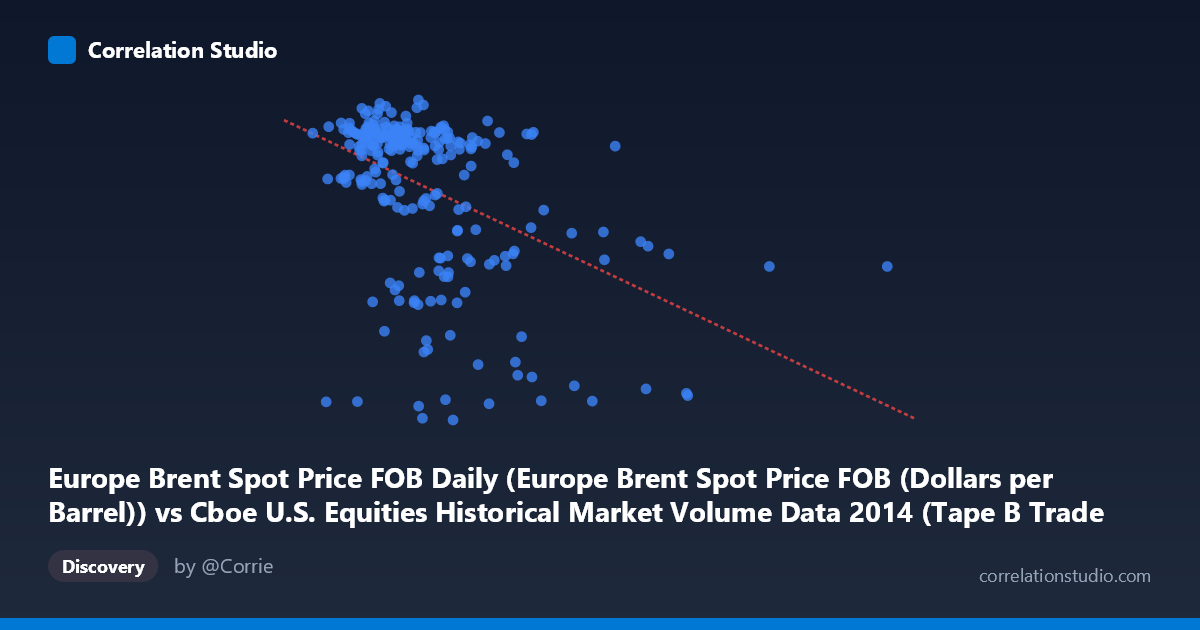
Europe Brent Spot Price FOB Daily (Europe Brent Spot Price FOB (Dollars per Barrel)) vs Cboe U.S. Equities Historical Market Volume Data 2014 (Tape B Trade Count)
- Pearson correlation (r)
- -0.4503
- Spearman correlation
- -0.4185
- p-value
- 0
- Sample size (n)
- 252
- 95% confidence interval
- -0.5436 to -0.3459
- Granger causality
- None
- Granger optimal lag
- 2
AI analysis
Analysis: Europe Brent Spot Price vs. Cboe Tape B Trade Count (2014)
Relationship Overview The scatterplot reveals a moderate negative relationship between Europe Brent crude oil spot prices (X-axis) and Cboe U.S. Equities Tape B trade counts (Y-axis) across 252 trading days in 2014. The linear regression equation (y = -9.00276E-05x + 118.826) confirms that as Brent crude prices increase, Tape B trade counts tend to decline. Visually, the data shows a discernible downward trend, though with considerable scatter around the regression line, suggesting the relationship is real but far from deterministic. The bulk of observations cluster in the lower X range (roughly 110,000–300,000 range for the price-scaled X variable), with a visible thinning of points at higher values.
Correlation Strength and Statistical Significance The Pearson correlation of r = -0.4503 indicates a moderate negative association, but the explanatory power is modest: R² = 0.2027, meaning only about 20.3% of the variance in Tape B trade counts is explained by Brent crude prices. The remaining ~80% of variation is attributable to other factors entirely. The 95% confidence interval of [-0.5436, -0.3459] is reasonably tight and does not include zero, and the p-value of 5.55 × 10⁻¹⁴ confirms the correlation is highly statistically significant — almost certainly not a chance finding given N = 3,686. However, statistical significance here is partly a function of the large population size, so practical significance deserves scrutiny. Critically, Granger causality tests in both directions fail to reach significance (X→Y: F = 1.37, p = 0.255; Y→X: F = 0.82, p = 0.444), meaning neither variable temporally predicts the other at a 2-period lag. This is an important caveat: the correlation exists, but there is no evidence of a leading/lagging predictive relationship in the time series sense.
Notable Patterns, Clusters, and Outliers Several structural features stand out in the data. There appears to be a distinct cluster of high trade-count observations (Y ≈ 105–115) concentrated at lower X values (roughly X < 250,000), suggesting that when crude prices are in a lower range, equity trading activity on Tape B is elevated and relatively consistent. Conversely, at higher X values, Y values spread more broadly and trend lower. A number of apparent outliers are visible: points with very low Y values (near 55–65, e.g., (218493.86, 55.60), (284027.79, 58.31), (123786.21, 58.67)) appear to fall well below the main cluster regardless of X position, hinting at specific low-volume trading days (possibly holidays, half-days, or market disruptions) rather than crude-oil-driven effects. The sample point (478251.00, 60.26) and (559868.36, 84.02) at extreme X values also suggest the relationship may become less well-defined at the tails.
Confounding Factors and Interpretive Caveats The most significant caveat is the risk of spurious correlation through shared temporal trends. Both Brent crude prices and U.S. equity trade volumes experienced notable secular movements in 2014 — crude oil underwent a sharp decline in the second half of the year, while equity market volumes can fluctuate seasonally and in response to broad macro events. This means the negative correlation may partly reflect co-trending over time rather than a direct causal mechanism. The low-Y outliers (likely abbreviated trading sessions) could be artificially inflating the correlation. Additionally, Tape B specifically covers NYSE American (AMEX) and regional exchange stocks, which may not be the most sensitive barometer of oil-market-driven trading behavior compared to broader market indices. The dataset's X-axis labeling also appears to involve a column mismatch (Brent price data attributed to the Cboe dataset and vice versa), which warrants verification of data alignment before drawing firm conclusions.
Actionable Insights and Further Investigation Despite the Granger causality null results, the moderate correlation warrants deeper exploration. Analysts should consider controlling for date-based seasonality and removing known half-trading-day observations to assess whether the correlation persists in a cleaner sample. Investigating whether the relationship strengthened specifically during the crude oil price crash of H2 2014 — a period of significant market stress — could reveal whether the correlation is regime-dependent rather than constant throughout the year. It would also be valuable to test this relationship against Tape A and Tape C trade counts to determine whether the effect is Tape B-specific or market-wide. Finally, introducing VIX (volatility index) or macroeconomic control variables as covariates in a multivariate regression could help isolate whether crude prices carry any independent explanatory power for equity trading activity, or whether both variables are simply responding to a common underlying factor such as investor risk appetite or global growth expectations.
X dataset: Cboe U.S. Equities Historical Market Volume Data 2014
Y dataset: Europe Brent Spot Price FOB Daily
Part of experiment: Daily - Cboe U.S. Equities Historical Market Volume Data 2014 vs Europe Brent Spot Price FOB Daily