US Employment and Unemployment (not_in_labor) vs Open data: UK macroeconomic series from 1086 to present. Bank of England Millennium of Macroeconomic Data. (Month) (value)
- Pearson correlation (r)
- 0.9106
- Spearman correlation
- 0.9952
- p-value
- 0
- Sample size (n)
- 77
- 95% confidence interval
- 0.8626 to 0.9424
- Granger causality
- None
- Granger optimal lag
- 10
AI analysis
Scatterplot Analysis: UK Macroeconomic Data vs. US Labor Force (Not in Labor)
Relationship Overview
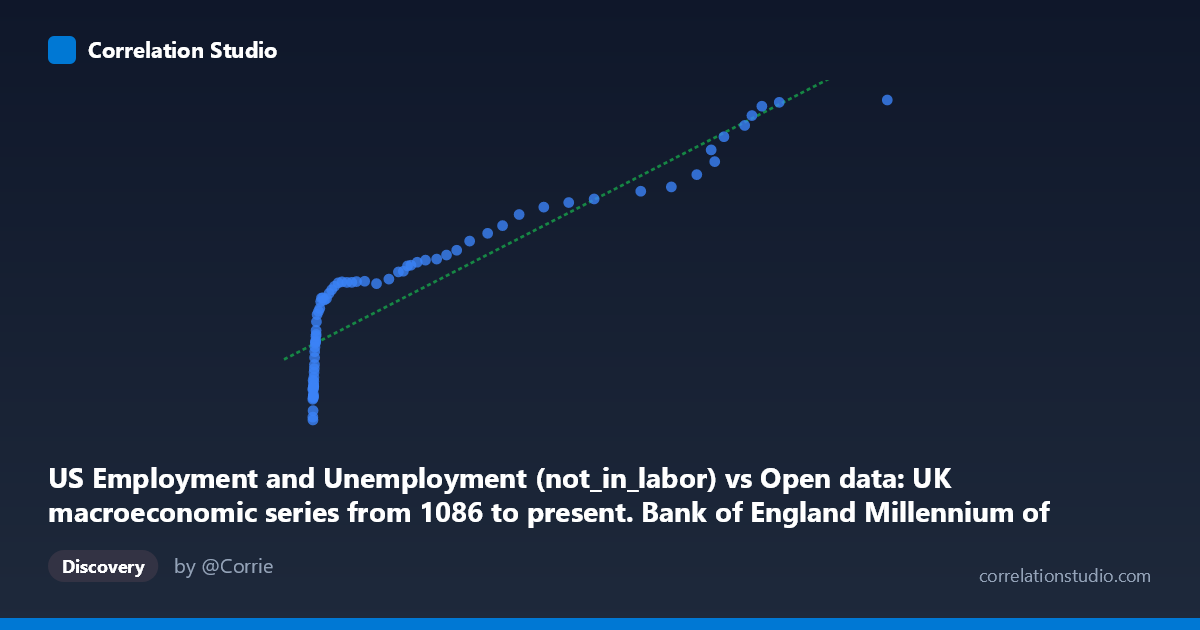
The scatterplot reveals a strong positive relationship between the US "not in labor force" population count (X-axis) and a UK macroeconomic value from the Bank of England Millennium dataset (Y-axis). As the number of Americans outside the labor force increases — ranging from roughly 164 to nearly 117,000 (likely in thousands) — the UK macroeconomic indicator rises correspondingly from approximately 38,590 to 94,759. The linear regression equation y = 0.445x + 51,741 describes this trend, though the relationship appears to follow a logarithmic or power-law curve rather than a strictly linear path, with the most rapid Y-gains occurring at lower X values before the relationship flattens somewhat at higher values.
Correlation Strength and Statistical Significance
The correlation is notably strong at r = 0.9106, and the coefficient of determination r² = 0.8293 indicates that approximately 83% of the variance in the UK macroeconomic variable is statistically explained by variation in US non-labor-force participation. The 95% confidence interval of [0.863, 0.942] is relatively narrow, suggesting this estimate is stable, and the p-value of effectively zero confirms the relationship is highly unlikely to be due to chance across the 77 paired observations spanning 1941–2017. However, despite this impressive statistical association, the Granger causality tests tell a critical story: neither direction (X→Y: F=1.69, p=0.112; Y→X: F=1.42, p=0.201) reaches statistical significance at conventional thresholds, even at an optimal lag of 10 periods. This means that knowing past values of one series does not meaningfully improve forecasts of the other beyond what each series predicts on its own — a fundamental limitation on any causal interpretation.
Patterns, Clusters, and Notable Features
The data exhibits a distinct two-regime structure. A dense cluster of points occupies the lower-left region (X < ~10,000, Y between ~38,500–63,000), corresponding broadly to earlier decades when the US non-labor-force population was smaller. A second, more dispersed cluster spreads across the upper-right (X ~40,000, Y ~74,000), representing more recent periods. The transition between these regimes appears somewhat abrupt rather than smoothly linear, reinforcing the impression of a logarithmic or sigmoidal functional form. A few potential outliers are visible at the extreme upper right — points near X = 94,899–116,836 with Y values approaching 94,000–95,000 — which may exert disproportionate leverage on the regression slope. The point at (210, 38,590) anchors the lower bound and similarly has high leverage.
Confounding Factors and Caveats
The most important caveat here is the dataset mismatch: one series is US labor market data and the other is a UK macroeconomic indicator (possibly nominal GDP, price level, wages, or money supply given the Bank of England dataset's contents). These two economies share common global macroeconomic trends — post-WWII growth, inflation cycles, globalization, and financialization — meaning both series are likely driven by a third variable: global time trends. Both series are almost certainly non-stationary (trending upward over 1941–2017), and correlating two non-stationary time series without differencing or cointegration testing is a textbook case of spurious correlation. The failure of Granger causality tests, despite the high r², is consistent with this interpretation. The linear model may also be misspecified given the apparent curvature in the data.
Actionable Insights and Further Investigation
Given the likely spurious nature of this correlation, the most pressing next step would be to detrend both series (e.g., first-differencing or HP filtering) and retest the correlation on the stationary residuals — the r² would almost certainly drop dramatically. Researchers should also identify the specific UK variable (the Y-axis label is ambiguous), as understanding its economic nature is prerequisite to any meaningful interpretation. A cointegration test (e.g., Engle-Granger or Johansen) would clarify whether a genuine long-run equilibrium relationship exists, as opposed to shared trending behavior. Extending the Granger causality analysis with alternative lag structures and controlling for global macroeconomic shocks (oil prices, global GDP, financial crises) could reveal whether any residual predictive relationship exists once common drivers are removed. This relationship should currently be treated as a correlational artifact of parallel historical trends rather than evidence of any meaningful economic linkage between UK macroeconomics and US labor force participation.
X dataset: Open data: UK macroeconomic series from 1086 to present. Bank of England Millennium of Macroeconomic Data. (Month)
Y dataset: US Employment and Unemployment
Part of experiment: Yearly - Open data: UK macroeconomic series from 1086 to present. Bank of England Millennium of Macroeconomic Data. (Month) vs US Employment and Unemployment