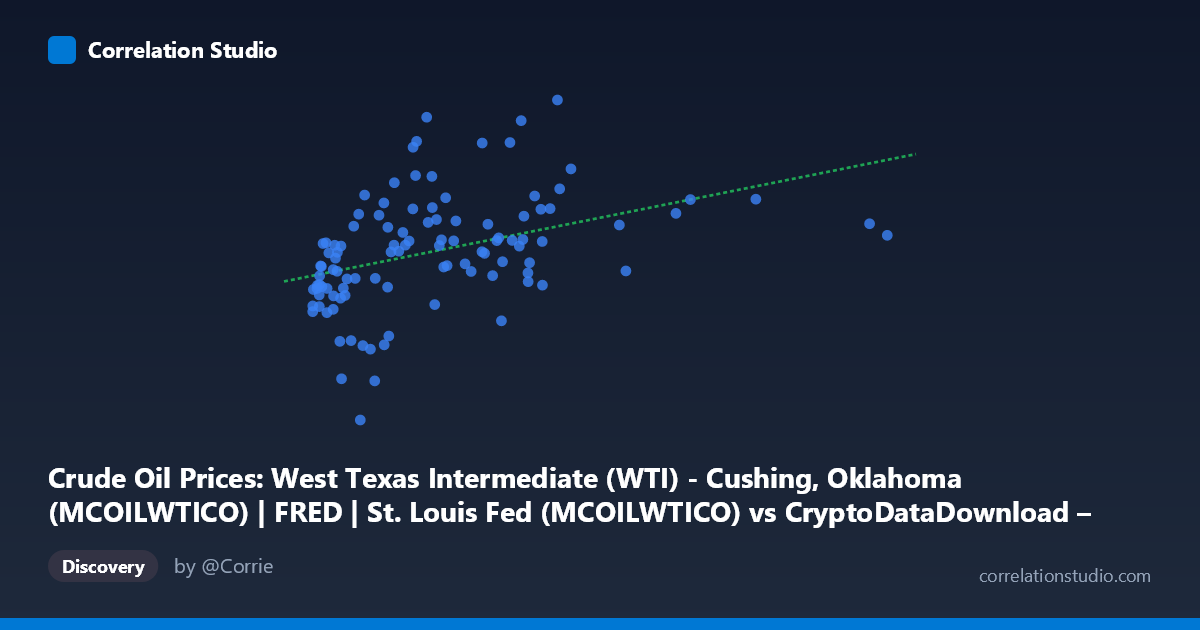
Crude Oil Prices: West Texas Intermediate (WTI) - Cushing, Oklahoma (MCOILWTICO) | FRED | St. Louis Fed (MCOILWTICO) vs CryptoDataDownload – Binance BTC/USDT Daily OHLCV (Volume USDT)
- Pearson correlation (r)
- 0.4031
- Spearman correlation
- 0.5428
- p-value
- 0.000018
- Sample size (n)
- 106
- 95% confidence interval
- 0.23 to 0.5514
- Granger causality
- None
- Granger optimal lag
- 5
- Time coverage
- 2017-09-01 to 2026-06-01
- Recomputed on refreshed data
- 2026-10-09 (r was 0.403)
AI analysis
Analysis: BTC/USDT Volume vs. WTI Crude Oil Price
Note on axis labeling: The variable names appear swapped in the metadata (X is labeled as WTI price but shows values in the billions, consistent with Binance trading volume; Y ranges 16.55–114.84, consistent with oil price in USD/barrel). The analysis below treats X as BTC/USDT trading volume and Y as WTI crude oil price, based on the actual data ranges.
1. What the Visualization Reveals
The scatterplot shows a weak-to-moderate positive association between BTC trading volume and WTI crude oil prices. As volume increases from the low millions into the billions, oil prices show a mild upward drift, but the relationship is loose and noisy — high oil prices (80–110) appear across a wide span of volume levels, and low volumes (under $500M) still produce oil prices ranging from ~17 to ~86. There is no clean linear band; instead, points are scattered broadly around the regression line.
2. Strength, Direction, and Statistical Confidence
The Pearson correlation (r = 0.403) indicates a modest positive relationship, and r² = 0.162 means only about 16% of the variance in oil prices is explained by trading volume — the remaining 84% is driven by other factors entirely. The 95% CI [0.230, 0.551] is fairly wide but excludes zero, and the p-value (1.85×10⁻⁵) confirms the correlation is statistically significant and not due to chance at this sample size (n=106). However, statistical significance here reflects a real but practically weak relationship — not a strong predictive one. Critically, the Granger causality tests show no significant predictive direction in either direction (X→Y p=0.083, Y→X p=0.394), meaning past values of one variable do not reliably forecast the other. This suggests the correlation is likely driven by a shared external trend (e.g., both being influenced by macroeconomic cycles, time period, or risk sentiment) rather than one variable causing changes in the other.
3. Notable Patterns and Outliers
Several points stand out: very low oil prices (16.55, 38–40) appear at moderate-to-low volume levels, likely capturing the 2020 COVID-era oil price collapse combined with then-lower crypto volumes. Conversely, high oil prices (100+) cluster at low-to-mid volumes (~1.3–1.5B), plausibly corresponding to the 2022 energy price spike. At the extreme high end of volume (~7.4B), oil price sits at a middling 73–77, not exceptionally high — suggesting no strong volume-price scaling at the tail. The relationship also looks somewhat heteroscedastic: variance in Y is wide at low-to-mid X and appears to narrow slightly at very high X, hinting at a possible non-linear (log or saturating) pattern rather than a strict linear one, consistent with the note that Spearman ρ exceeds Pearson r.
4. Confounding Factors and Caveats
This is almost certainly a spurious or confounded correlation driven by shared time trends rather than a causal economic link. Both crypto trading volume and oil prices have independently trended upward over 2017–2026 due to market maturation (BTC) and macro/geopolitical cycles (oil), so any two time series with upward drift will show positive correlation without direct interaction. Key confounders include: overall crypto market growth/adoption cycles, macroeconomic conditions (inflation, interest rates, USD strength) affecting both risk assets and commodities, geopolitical shocks (e.g., 2022 Russia-Ukraine war spiking oil, unrelated to crypto volume), and COVID-19 market disruptions affecting both markets simultaneously in 2020. The data are also monthly/irregular oil prices matched to potentially daily-aggregated crypto volume, and volume itself is highly right-skewed (mean $1.56B, stdev $1.45B, max $7.4B), meaning a handful of high-volume periods could disproportionately influence the fit.
5. Suggestions for Further Investigation
Given the lack of Granger causality and modest r², this correlation should not be used for trading or forecasting purposes as-is. Recommended next steps: (1) detrend or difference both series to test correlation of returns/changes rather than levels, which would better isolate genuine co-movement from shared drift; (2) test log-transformed volume given its skew and the hinted non-linear relationship; (3) include control variables like USD index, equity market volatility (VIX), or overall crypto market cap to check if oil-volume correlation persists after controlling for broader risk-on/risk-off sentiment; (4) segment the analysis by known regime periods (2020 COVID crash, 2022 energy crisis, 2024+ bull market) to see if the correlation is regime-dependent rather than stable; and (5) verify the axis/column labeling given the apparent mismatch noted above, since correct variable identification is essential before drawing economic conclusions.
X dataset: CryptoDataDownload – Binance BTC/USDT Daily OHLCV
Y dataset: Crude Oil Prices: West Texas Intermediate (WTI) - Cushing, Oklahoma (MCOILWTICO) | FRED | St. Louis Fed
Part of experiment: Bitcoin - CryptoDataDownload – Binance BTC/USDT Daily OHLCV vs Crude Oil Prices: West Texas Intermediate (WTI) - Cushing, Oklahoma (MCOILWTICO) | FRED | St. Louis Fed