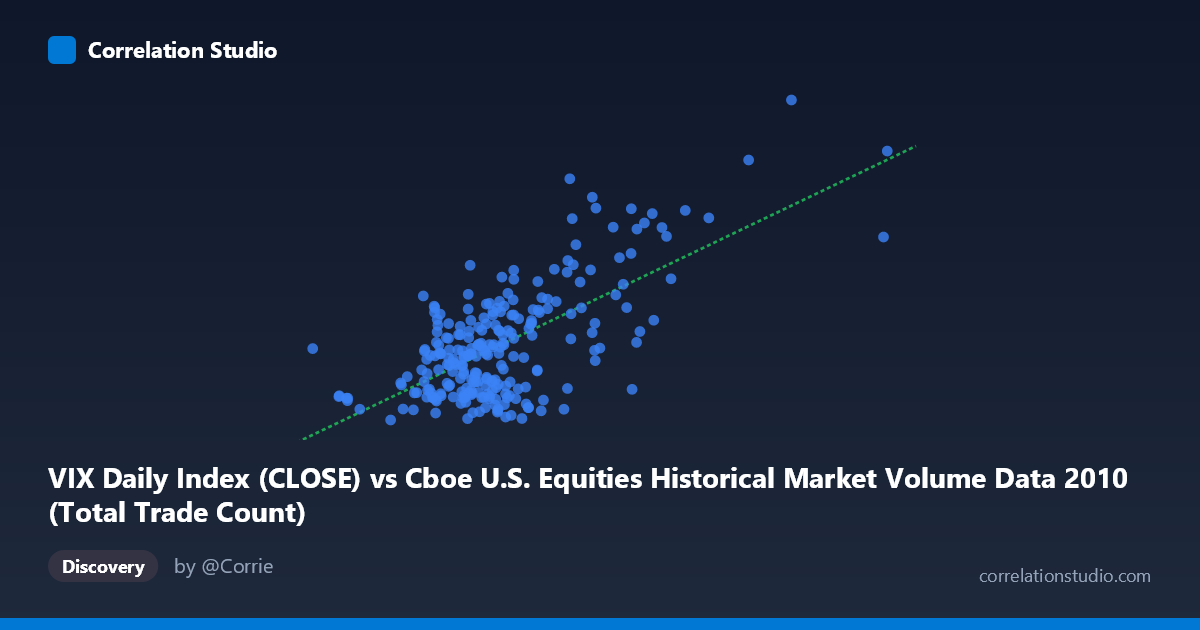
VIX Daily Index (CLOSE) vs Cboe U.S. Equities Historical Market Volume Data 2010 (Total Trade Count)
- Pearson correlation (r)
- 0.6681
- Spearman correlation
- 0.4706
- p-value
- 0
- Sample size (n)
- 252
- 95% confidence interval
- 0.5936 to 0.7313
- Granger causality
- Y → X
- Granger optimal lag
- 1
AI analysis
Scatterplot Analysis: VIX vs. U.S. Equity Market Trade Count (2010)
Relationship Overview
The scatterplot reveals a moderate-to-strong positive relationship between the VIX Daily Close Index and the Total Trade Count in U.S. equity markets throughout 2010. As VIX levels rise — indicating higher expected market volatility — trading activity as measured by total trade count tends to increase correspondingly. The fitted linear regression line (y = 5.3598E-06x + 10.5679) captures this upward trend, though considerable scatter around the line suggests the relationship is real but imperfect. This aligns intuitively with market microstructure theory: elevated volatility environments typically drive heightened trader activity as participants respond to rapidly changing prices, hedge existing positions, or opportunistically exploit price swings.
Correlation Strength and Statistical Significance
The Pearson correlation of r = 0.6681 reflects a meaningfully positive association, but the more telling figure is r² = 0.4464 — indicating that VIX explains approximately 44.6% of the variance in total trade count. While substantial, this also means roughly 55% of variation remains unexplained, pointing to other important drivers of trading volume. The 95% confidence interval for r of [0.5936, 0.7313] is relatively tight given the sample size of n = 252, and the p-value of essentially zero confirms this relationship is not a statistical artifact. Critically, the Granger causality analysis points in a clear and practically important direction: Y Granger-causes X (F = 7.8821, p = 0.0054) at a 1-period lag, meaning past VIX values significantly predict future trade counts, while the reverse (X→Y: F = 3.6827, p = 0.0561) falls just short of conventional significance thresholds. This unidirectional temporal relationship suggests that volatility expectations lead trading activity, rather than trading activity driving VIX — a finding consistent with VIX's role as a forward-looking fear gauge.
Notable Patterns, Clusters, and Outliers
The data exhibit several visually distinct features. The bulk of observations cluster in the lower-left region, roughly corresponding to VIX values between 1.5M–2.5M trade count and VIX readings of 15–25, reflecting the relatively calm baseline trading environment that characterized much of 2010's recovery period. A secondary, sparser cluster emerges at higher VIX levels (30–42) paired with elevated trade counts (30M+), likely corresponding to episodic volatility spikes such as the May 2010 Flash Crash and European sovereign debt concerns. Two points stand out as potential outliers: the observation near (5,514,534; 40.95) represents an extreme X-value well beyond the main data cloud, and the point near (2,825,615; 38.32) shows unusually high VIX for a mid-range trade count. These outliers could disproportionately influence the regression slope and should be examined individually for data integrity and event-specific context.
Confounding Factors and Caveats
Several important caveats warrant caution in interpreting this correlation causally. First, 2010 was a structurally unusual year — markets were still recovering from the 2008–2009 financial crisis, and the Flash Crash on May 6, 2010 introduced extreme single-day distortions that may inflate both correlation strength and the Granger causality signal. Second, the axes appear to be swapped in the dataset metadata: the X-axis label references "VIX Daily Index (CLOSE)" yet the column source is labeled as the Cboe Market Volume dataset, and vice versa for Y — analysts should verify the variable assignment before drawing firm conclusions. Third, algorithmic and high-frequency trading activity in 2010 was rapidly evolving, meaning trade count is not a simple proxy for human investor sentiment. HFT systems may independently amplify both volatility and trade counts through feedback loops, introducing endogeneity. Finally, macro-calendar events (FOMC announcements, earnings seasons, options expiration dates) likely confound the relationship, as they simultaneously elevate VIX and drive discrete surges in trade volume.
Actionable Insights and Further Investigation
Given the Granger causality finding that VIX leads trade count, practitioners could explore VIX as a short-term trading activity forecasting signal — for example, exchange operators or liquidity providers might use prior-day VIX to anticipate next-day capacity demands or bid-ask spread adjustments. Further investigation should include: (1) segmenting the data by event type (Flash Crash days, FOMC dates, options expiration) to isolate whether the correlation is regime-dependent; (2) testing non-linear models (e.g., polynomial or log-transformed regression), since the scatter pattern hints at heteroscedasticity with variance expanding at higher VIX levels; (3) extending the analysis across multiple years to assess whether the r = 0.67 relationship is stable or specific to 2010's unique volatility regime; and (4) incorporating additional controls such as market capitalization, sector composition of volume, and intraday time-of-day effects to better isolate the VIX-volume mechanism and improve the unexplained 55% of variance.
X dataset: Cboe U.S. Equities Historical Market Volume Data 2010
Y dataset: VIX Daily Index
Part of experiment: Daily - Cboe U.S. Equities Historical Market Volume Data 2010 vs VIX Daily Index