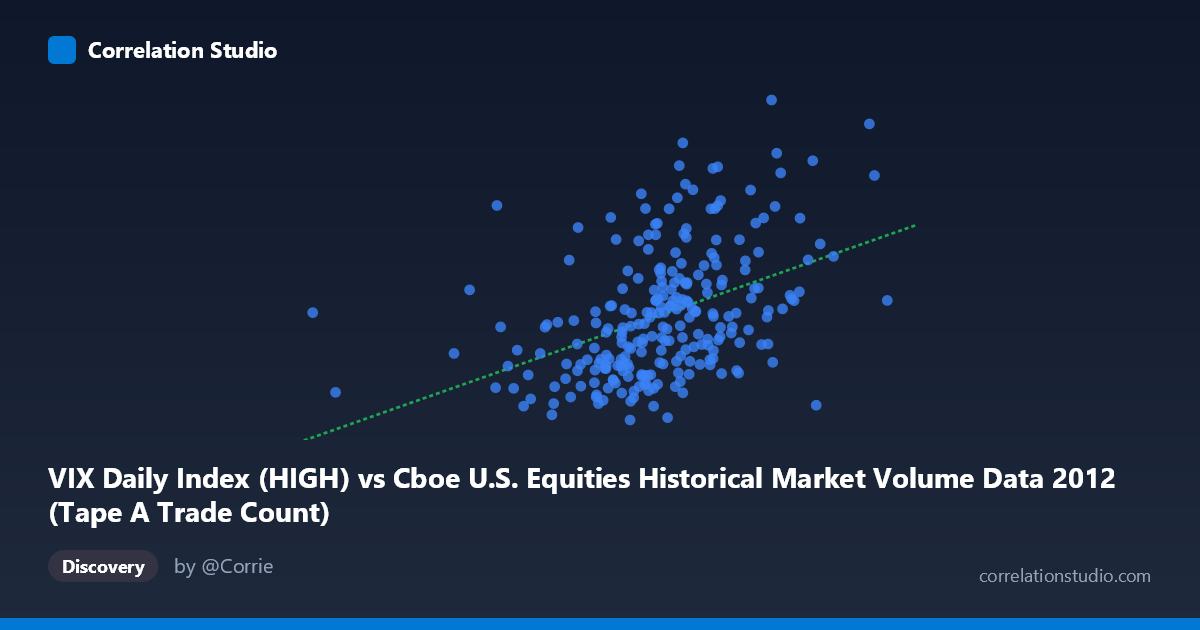
VIX Daily Index (HIGH) vs Cboe U.S. Equities Historical Market Volume Data 2012 (Tape A Trade Count)
- Pearson correlation (r)
- 0.4298
- Spearman correlation
- 0.4759
- p-value
- 0
- Sample size (n)
- 250
- 95% confidence interval
- 0.3229 to 0.5258
- Granger causality
- None
- Granger optimal lag
- 1
AI analysis
Scatterplot Analysis: VIX Daily Index (HIGH) vs. Tape A Trade Count
Overall Relationship
The scatterplot reveals a moderate positive relationship between the CBOE VIX Daily Index High values and Tape A Trade Count activity on U.S. equities exchanges throughout 2012. As VIX High values increase, trade counts tend to rise as well, which aligns intuitively with market microstructure theory: elevated volatility typically drives heightened trading activity as investors rebalance portfolios, execute hedges, or respond to rapidly changing price signals. The linear regression equation (y = 8.04×10⁻⁶x + 10.52) captures this upward trend, though the relatively modest slope suggests the relationship, while real, is far from deterministic.
Correlation Strength and Statistical Significance
The Pearson correlation of r = 0.4298 indicates a moderate positive association, but the explanatory power is notably limited — the R² of 0.1847 means that only 18.5% of the variance in Tape A Trade Count is explained by VIX High values, leaving more than 80% of variability attributable to other factors. The 95% confidence interval of [0.3229, 0.5258] is reasonably tight given the sample size of 250, and the p-value of 1.16×10⁻¹² confirms the correlation is statistically significant well beyond conventional thresholds. However, statistical significance here is partly a function of the large population (N = 3,750) and should not be conflated with practical or economic significance. Critically, the Granger causality tests fail in both directions (X→Y: F = 0.134, p = 0.715; Y→X: F = 0.380, p = 0.538), meaning neither variable reliably predicts the other at a one-period lag. This absence of temporal directionality substantially weakens any causal narrative between VIX spikes and subsequent trade count changes.
Notable Patterns, Clusters, and Outliers
The sample points reveal several features worth flagging. There is a visible concentration of observations in the mid-range of X (roughly 900,000–1,100,000) corresponding to moderate VIX High values (16–21), suggesting these conditions represent typical 2012 market operating conditions. A handful of points at elevated Y values (trade counts exceeding 23–27) occur across a wide range of X values, including some at relatively modest VIX readings, which introduces notable vertical scatter at intermediate X values. Conversely, the lower-left region shows observations with both low VIX and low trade counts (e.g., ~732,000–800,000 X range with Y values of 14–18), consistent with quiet, low-volatility trading sessions. The wide vertical spread at any given X value is perhaps the most visually striking feature, reinforcing that VIX alone explains only a fraction of trade count variation.
Confounding Factors and Interpretive Caveats
Several confounds complicate interpretation. First, the axis labels appear swapped from what might be expected — the X-axis is labeled as a VIX component but contains values in the hundreds of thousands to millions, more consistent with volume or trade count data, while the Y-axis values in the 14–28 range align with typical VIX index readings. This labeling inconsistency warrants verification before drawing firm conclusions. Second, day-of-week and calendar effects (options expiration dates, end-of-quarter rebalancing, holiday trading sessions) likely drive both VIX spikes and trade count surges simultaneously, creating spurious co-movement. Third, macro events in 2012 — European debt crisis developments, U.S. fiscal cliff concerns, presidential election — could create episodic clusters that inflate the apparent correlation. Finally, aggregating across all Tape A venues masks venue-level heterogeneity in how individual exchanges respond to volatility regimes.
Actionable Insights and Further Investigation
Given the absence of Granger causality, practitioners should be cautious about using VIX High values as a predictive signal for next-period trade counts, or vice versa. Further investigation should consider: (1) testing non-linear specifications (e.g., polynomial or spline regression) since the scatter suggests potential curvature at high VIX levels; (2) segmenting by market regime (low/medium/high volatility periods) to test whether the correlation strengthens within specific volatility environments; (3) incorporating lagged variables beyond one period and additional controls such as SPX returns, bid-ask spreads, or news sentiment indices to improve explanatory power; and (4) resolving the axis labeling discrepancy to ensure the variables are correctly attributed before any operational decisions are made based on this analysis.
X dataset: Cboe U.S. Equities Historical Market Volume Data 2012
Y dataset: VIX Daily Index
Part of experiment: Daily - Cboe U.S. Equities Historical Market Volume Data 2012 vs VIX Daily Index