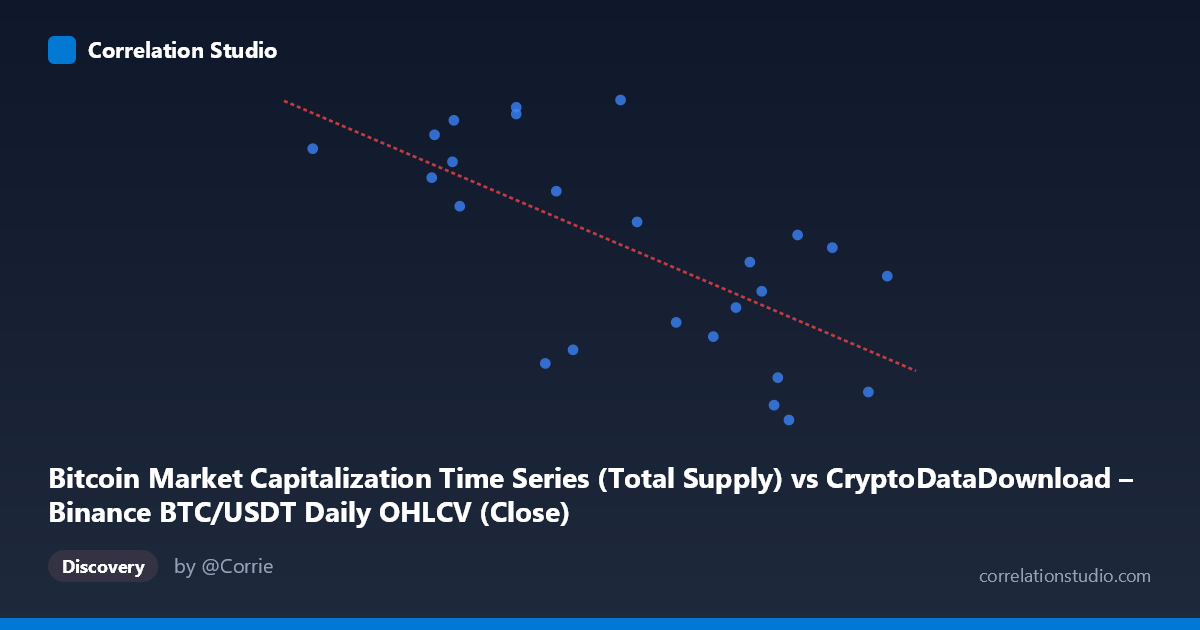
Bitcoin Market Capitalization Time Series (Total Supply) vs CryptoDataDownload – Binance BTC/USDT Daily OHLCV (Close)
- Pearson correlation (r)
- -0.6719
- Spearman correlation
- -0.6592
- p-value
- 0.000235
- Sample size (n)
- 25
- 95% confidence interval
- -0.8432 to -0.3768
- Granger causality
- None
- Granger optimal lag
- 6
- Time coverage
- 2024-03-29 to 2024-04-22
AI analysis
Analysis of BTC Market Cap vs. Price Relationship
1. Overview of the Relationship
The scatterplot displays a moderate negative linear relationship between the two variables (labeled X: market cap, Y: closing price), both derived from the same underlying BTC/USDT Binance dataset over a short ~3.5 week window (March 29–April 22, 2024). Points trend downward from upper-left to lower-right, though with considerable scatter around the fitted line, indicating the relationship is present but not tight.
2. Strength, Direction, and Statistical Confidence
The correlation coefficient of r = -0.6719 indicates a moderately strong negative linear association, with r² = 0.4514 meaning only about 45% of the variance in Y is explained by X — leaving more than half of the variability unaccounted for by this linear model. The 95% confidence interval [-0.8432, -0.3768] is fairly wide, reflecting the small sample size (n=25), but it excludes zero, and the p-value (0.000235) confirms this negative correlation is statistically significant and unlikely due to chance. However, the Granger causality tests show no predictive direction (X→Y: p=0.84; Y→X: p=0.88) — neither variable helps forecast the other's future values at any tested lag. This is a critical caveat: correlation exists in the static/contemporaneous sense, but there is no evidence of a lead-lag temporal relationship, meaning this pair should not be used for forecasting one from the other's past values.
3. Notable Patterns and Features
The data doesn't show obvious clustering or discrete regimes — points are fairly evenly distributed across the X range (61,277–71,620) and Y range (19.67M–19.69M), suggesting continuous variation rather than distinct market states. No strong outliers are evident; the scatter is roughly elliptical, consistent with the moderate linear r². There's no clear evidence of non-linearity (e.g., curvature or threshold effects) — the linear fit seems like a reasonable if imperfect descriptor of the relationship.
4. Confounding Factors and Caveats
A crucial red flag: both variables originate from the same source series (Binance BTC/USDT OHLCV), with X labeled "Market Cap (Total Supply)" and Y labeled "Close" price — these are likely mechanically related (market cap = price × circulating supply) rather than independent economic variables. If circulating supply was roughly constant over this short window, X and Y should be almost perfectly correlated (r≈1), not moderately negative. The observed negative r may reflect a data alignment issue, timestamp mismatch, or unit inconsistency rather than a genuine economic relationship. Additionally, n=25 over less than a month is a small, short-term sample vulnerable to noise, and BTC price series are also non-stationary and autocorrelated, which can distort simple Pearson correlation estimates.
5. Recommendations for Further Investigation
Given the likely definitional overlap between "market cap" and "close price" from the same exchange feed, the first priority should be verifying data provenance and alignment — check whether timestamps, supply figures, or units were parsed/joined correctly, since a negative correlation between mechanically linked variables is suspicious. If the relationship is confirmed genuine, extending the time window (beyond 25 days) would tighten the confidence interval and improve robustness. Given the null Granger causality result, this pairing offers no forecasting value as configured; instead, consider testing differenced/returns series (rather than levels) to address non-stationarity, or explore other lag structures/cointegration tests suited to financial time series before drawing further causal or predictive conclusions.
X dataset: CryptoDataDownload – Binance BTC/USDT Daily OHLCV
Y dataset: Bitcoin Market Capitalization Time Series
Part of experiment: Bitcoin - CryptoDataDownload – Binance BTC/USDT Daily OHLCV vs Bitcoin Market Capitalization Time Series