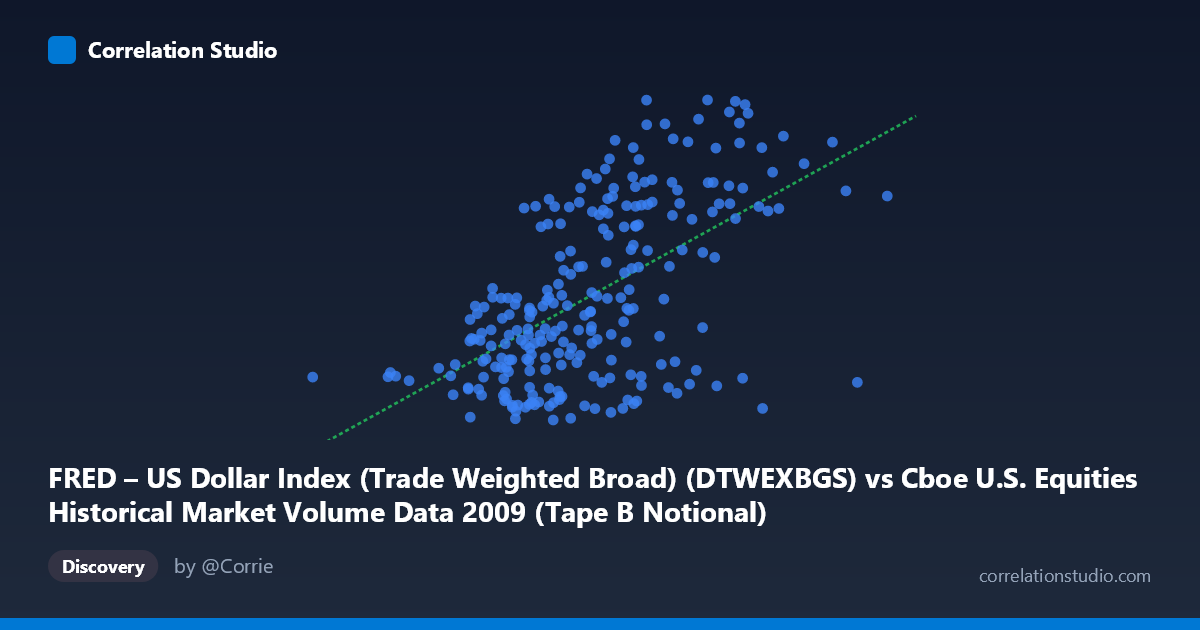
FRED – US Dollar Index (Trade Weighted Broad) (DTWEXBGS) vs Cboe U.S. Equities Historical Market Volume Data 2009 (Tape B Notional)
- Pearson correlation (r)
- 0.5773
- Spearman correlation
- 0.5456
- p-value
- 0
- Sample size (n)
- 248
- 95% confidence interval
- 0.4878 to 0.6548
- Granger causality
- None
- Granger optimal lag
- 1
AI analysis
Scatterplot Analysis: US Dollar Index vs. Cboe Tape B Notional Volume (2009)
Relationship Overview
The scatterplot reveals a moderate positive relationship between the US Dollar Index (Trade Weighted Broad) on the X-axis and Cboe Tape B Notional trading volume on the Y-axis across 248 trading days in 2009. As the dollar index increases — roughly spanning from ~1.3 billion to ~9.5 billion in the index units — Tape B notional values tend to rise from approximately 90.83 to 106.02. The linear regression equation (y = 1.84×10⁻⁹x + 87.01) suggests a very shallow but positive slope, reflecting that higher dollar index values are associated with modestly elevated notional trading volumes. The scatter is considerable, however, indicating this is far from a deterministic relationship.
Correlation Strength and Statistical Significance
The Pearson correlation of r = 0.577 indicates a moderate positive association, but the more informative metric is r² = 0.333, meaning the dollar index accounts for only ~33% of the variance in Tape B notional volume — leaving roughly two-thirds of variability unexplained by this relationship alone. The 95% confidence interval of [0.488, 0.655] is moderately tight and does not cross zero, lending reasonable precision to the estimate. The p-value of effectively 0 (against N = 3,232) confirms this correlation is highly statistically significant and very unlikely to be a chance artifact. However, statistical significance here is partly a function of the large population size, and practical significance should be interpreted cautiously. Crucially, Granger causality tests reveal no significant directional predictive relationship in either direction (X→Y: F = 0.836, p = 0.361; Y→X: F = 1.449, p = 0.230), meaning that past values of the dollar index do not reliably predict future Tape B volumes, and vice versa. The correlation is contemporaneous rather than temporally causal.
Notable Patterns and Outliers
Several features stand out in the sample data. There is a noticeable cluster of observations in the mid-X range (~4.0–6.5 billion), where Y values span broadly from ~90.8 to ~106.0, suggesting high variability in trading volumes even when dollar index values are similar. At higher X values (~7.3–9.5 billion), Y values appear somewhat more consistently elevated (e.g., 100.75, 101.10, 103.00, 104.02, 105.12), hinting at a possible threshold effect or regime shift at the upper end. The minimum X value (1,320,771,983, Y = 92.87) appears as a potential outlier on the left tail, sitting well apart from the main cluster. Some counter-trend points are also visible — for instance, high-X observations with relatively low Y values (~91.38 at X ≈ 7.73 billion) — which dilute the regression fit and suggest non-linear dynamics may be at play.
Confounding Factors and Caveats
Several important caveats apply. First, 2009 was an extraordinary market year, encompassing the tail end of the Global Financial Crisis, the March 2009 equity market trough, and a sharp recovery — structural regime changes that could independently drive both dollar strength and trading volumes through common macro shocks (risk-off/risk-on dynamics), rather than through any direct link between the two variables. This represents a classic spurious correlation driven by a latent common factor (investor risk sentiment, Federal Reserve policy, or global capital flows). Second, the axis labels appear swapped relative to intuitive expectations — Tape B Notional is plotted on Y while the Dollar Index appears on X, which may reflect data pipeline decisions rather than a theoretically motivated causal direction. Third, the use of notional volume (in dollar terms) means the dollar index itself may mechanically inflate notional values, introducing a tautological component to the correlation. Finally, with only 248 paired samples drawn from a population of 3,232, sampling variability could affect cluster distributions.
Actionable Insights and Further Investigation
Given the moderate correlation but absent Granger causality, practitioners should not use dollar index levels as a leading indicator for Tape B volume in trading or risk models without further validation. Recommended next steps include: (1) controlling for the VIX or equity market returns as confounders to isolate any residual dollar-volume relationship; (2) testing for non-linear or threshold regression models, given the visual suggestion that the relationship may strengthen at extreme dollar index values; (3) decomposing the time series into pre- and post-March 2009 sub-periods to test whether the correlation is regime-dependent; (4) examining whether other Tape designations (A, C) show similar patterns, which would suggest a market-wide volume effect rather than a Tape B-specific phenomenon; and (5) applying cointegration tests to assess whether a longer-run equilibrium relationship exists even in the absence of short-run Granger causality.
X dataset: Cboe U.S. Equities Historical Market Volume Data 2009
Y dataset: FRED – US Dollar Index (Trade Weighted Broad)
Part of experiment: Daily - Cboe U.S. Equities Historical Market Volume Data 2009 vs FRED – US Dollar Index (Trade Weighted Broad)