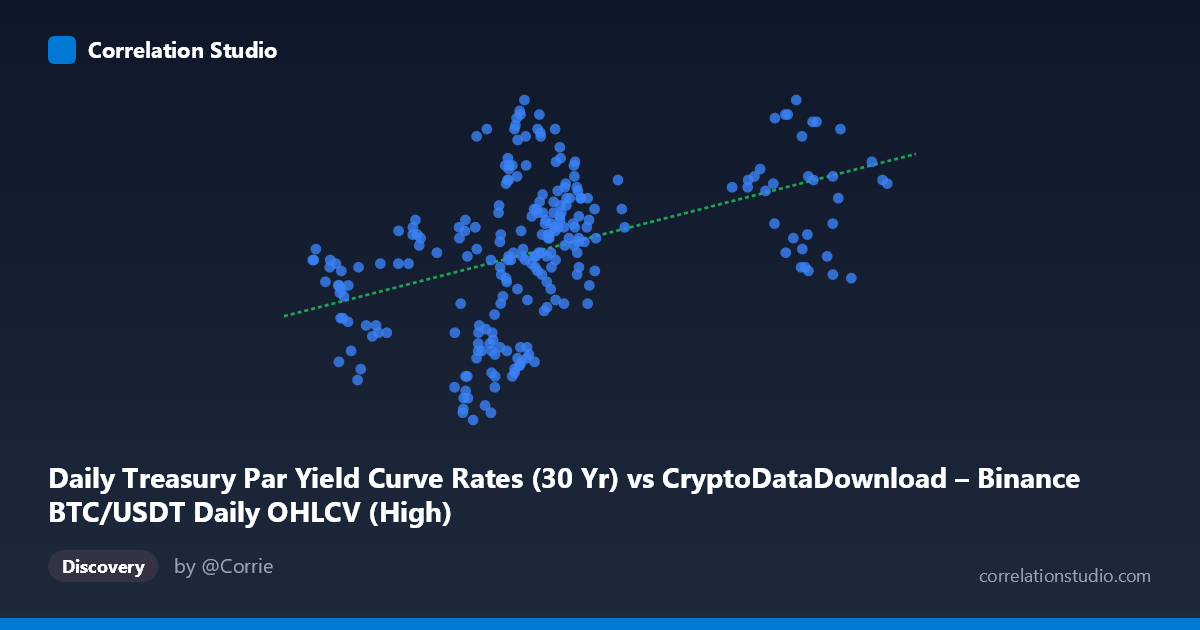
Daily Treasury Par Yield Curve Rates (30 Yr) vs CryptoDataDownload – Binance BTC/USDT Daily OHLCV (High)
- Pearson correlation (r)
- 0.4344
- Spearman correlation
- 0.5087
- p-value
- 0
- Sample size (n)
- 250
- 95% confidence interval
- 0.3281 to 0.5299
- Granger causality
- None
- Granger optimal lag
- 1
AI analysis
Analysis of Treasury Yield vs. BTC/USDT Daily High Correlation
Note on labeling: The axis descriptions appear swapped in the metadata — the X-axis values (40,176–108,353) are clearly BTC/USDT price data, while the Y-axis values (3.94–4.82) match 30-Year Treasury yields. This analysis proceeds with X = BTC price and Y = 30-Yr Treasury yield.
1. What the Visualization Reveals
The scatterplot shows a moderate positive linear relationship between BTC/USDT price levels and 30-year Treasury yields across 2024. As Bitcoin's price increases, Treasury yields tend to rise as well, though with considerable scatter around the trend line. The data clusters primarily in the $58,000–$72,000 range, with a secondary, sparser cluster in the $91,000–$103,000 range corresponding to late-2024 BTC price action.
2. Strength, Direction, and Statistical Confidence
The correlation coefficient (r = 0.4344) indicates a moderate positive relationship, but R² = 0.1887 reveals that only 18.9% of the variance in Treasury yields is explained by BTC price movements — leaving over 80% attributable to other factors. The 95% CI [0.328, 0.530] is reasonably tight and excludes zero, and the p-value (6.24E-13) confirms this correlation is highly statistically significant given the large sample (n=250) — this is not a chance finding. However, statistical significance with modest effect size means the relationship is real but weak in practical/explanatory terms.
Critically, the Granger causality tests show no significant predictive direction in either direction (X→Y: p=0.366; Y→X: p=0.095, only marginally suggestive). This means neither variable reliably leads the other in time — the correlation is likely contemporaneous co-movement driven by shared macro conditions (e.g., risk sentiment, Fed policy expectations, liquidity conditions) rather than one variable causing changes in the other.
3. Notable Patterns and Outliers
The data shows a bimodal X-distribution: a dense cluster of BTC prices between $57K–$72K (likely early-to-mid 2024) and a distinct higher cluster near $91K–$103K (likely Q4 2024, post-election rally). Within the lower cluster, Y-values are noisy and don't show a strong sub-trend, suggesting the overall correlation may be driven largely by the between-cluster shift — i.e., higher BTC prices later in the year coincided with a period of somewhat higher yields, rather than a smooth continuous relationship. Some low-yield outliers (Y≈3.94–4.11) appear scattered across BTC prices in the low $58K–$65K range, indicating volatility not explained by price alone.
4. Confounding Factors and Caveats
Both series are time-ordered macro/financial variables, making this a classic case of spurious or confounded correlation via a common driver — both BTC prices and long-term Treasury yields in 2024 were influenced by Fed rate expectations, inflation data, fiscal/political news (election), and general risk appetite. Neither series is stationary (both trended over the year), which can inflate correlation in level-based analysis even absent a true causal link. Additionally, comparing daily price levels (not returns) risks conflating trend with correlation — a more rigorous test would use daily returns/changes or first-differenced data.
5. Suggestions for Further Investigation
To clarify whether this is a genuine relationship or trend-driven artifact: (1) re-run the analysis on daily returns/changes rather than levels to remove trend contamination; (2) test for cointegration given both series trended over 2024; (3) control for a common macro factor (e.g., Fed funds rate expectations, DXY index, or equity market performance) via partial correlation or multivariate regression; and (4) segment by the two visible clusters (H1 vs H2 2024) to check whether the correlation holds within each period or is purely an artifact of the year-end shift in both series. Given the lack of Granger causality, this relationship should not be used for short-term predictive trading signals in either direction.
X dataset: CryptoDataDownload – Binance BTC/USDT Daily OHLCV
Y dataset: Daily Treasury Par Yield Curve Rates
Part of experiment: Bitcoin - CryptoDataDownload – Binance BTC/USDT Daily OHLCV vs Daily Treasury Par Yield Curve Rates