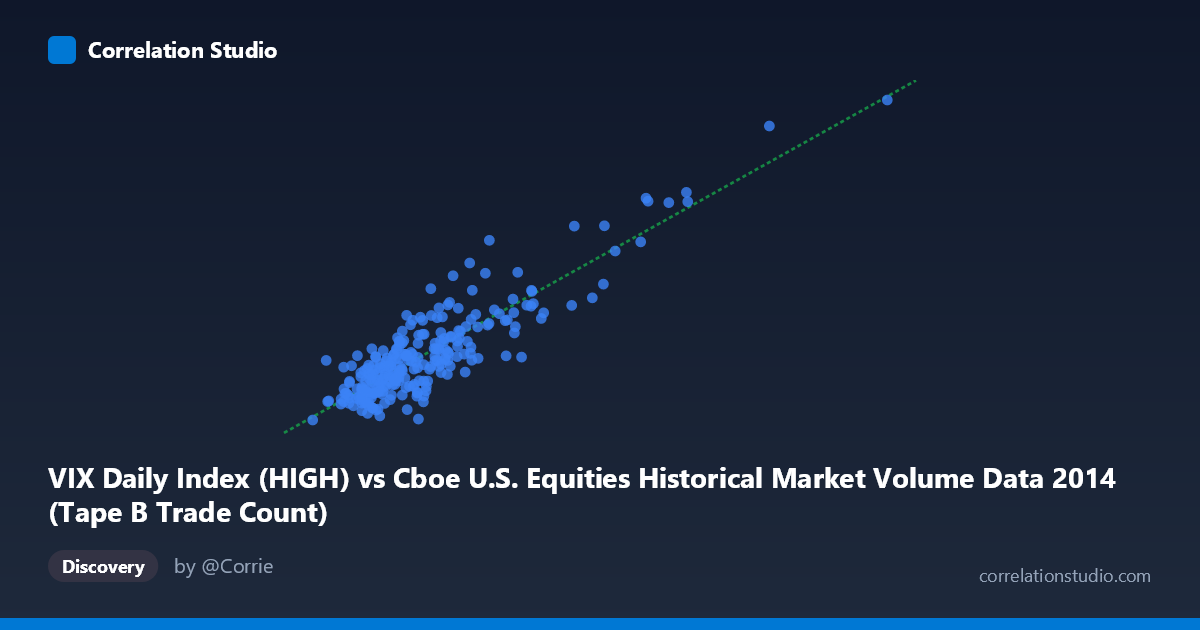
VIX Daily Index (HIGH) vs Cboe U.S. Equities Historical Market Volume Data 2014 (Tape B Trade Count)
- Pearson correlation (r)
- 0.883
- Spearman correlation
- 0.78
- p-value
- 0
- Sample size (n)
- 252
- 95% confidence interval
- 0.8525 to 0.9076
- Granger causality
- None
- Granger optimal lag
- 1
AI analysis
Scatterplot Analysis: VIX High vs. Tape B Trade Count (2014)
Relationship Overview
The scatterplot reveals a strong, positive linear relationship between the CBOE Volatility Index daily high (VIX HIGH) and the Tape B trade count for U.S. equities in 2014. As VIX HIGH increases — reflecting greater expected market volatility — the number of Tape B trades rises correspondingly. This is an intuitive pairing: periods of elevated market uncertainty tend to drive heightened trading activity across exchanges, including those covered by Tape B (NYSE American-listed securities). The linear regression equation (y = 3.595×10⁻⁵x + 6.986) captures this trend well, with the fitted line appearing to track the central tendency of the data cloud closely across the observed range.
Correlation Strength and Statistical Significance
The correlation is impressively strong at r = 0.8830, and the coefficient of determination r² = 0.7798 indicates that approximately 78% of the variance in Tape B trade counts is statistically explained by VIX HIGH levels — a notably high figure for financial market data, where noise typically dominates. The 95% confidence interval of [0.8525, 0.9076] is relatively tight, reflecting the precision afforded by a sample of 252 paired observations drawn from a population of 3,686, and the p-value of effectively zero confirms this relationship is not a statistical artifact. However, the Granger causality results complicate the narrative significantly: neither direction (X→Y: F=0.3628, p=0.5475; Y→X: F=0.0167, p=0.8972) achieves significance, meaning that despite the strong contemporaneous correlation, neither variable temporally predicts the other in a lead-lag sense. This suggests both variables respond simultaneously to common underlying market conditions rather than one driving the other sequentially.
Patterns, Clusters, and Outliers
The data cloud shows a reasonably tight linear band at lower VIX values (roughly X < 250,000), where the bulk of 2014 observations cluster — consistent with the year's generally calm volatility environment punctuated by brief spikes. However, there are several conspicuous high-leverage outliers in the upper-right region: notably the points near (559,868, 29.41) and (478,251, 25.20), which correspond to VIX spikes likely associated with episodic market stress events in late 2014 (e.g., geopolitical tensions or Federal Reserve communications). These extreme points exert disproportionate influence on the regression slope and correlation coefficient, and their removal could meaningfully alter the estimated relationship. A slight funnel or heteroscedastic pattern may also be present — variance in trade counts appears to increase at higher VIX levels — which would violate ordinary least squares assumptions and suggest the linear model understates uncertainty at the extremes.
Confounding Factors and Caveats
Several important caveats temper interpretation. First, both variables are likely driven by a common latent factor — market stress or risk sentiment — making the correlation spurious in a causal sense, a conclusion directly supported by the failed Granger tests. Second, day-of-week, month-end, and options expiration effects can simultaneously elevate both VIX readings and trade volumes independently of any direct connection. Third, the VIX HIGH column represents the intraday peak rather than a closing or average value, which may introduce upward bias on volatile days and inflate the apparent relationship. Finally, 2014 was a structurally unusual year for volatility — predominantly low with sharp episodic spikes — so this model may not generalize to years with sustained elevated volatility (e.g., 2020).
Actionable Insights and Further Investigation
Practitioners should treat this correlation as a useful contemporaneous signal rather than a predictive tool: VIX HIGH and Tape B trade volume can inform real-time assessments of market activity regimes, but neither leads the other. For deeper analysis, it would be valuable to: (1) test non-linear specifications (e.g., log-log or polynomial regression) given the potential heteroscedasticity and the known right-skewed nature of volatility distributions; (2) decompose the VIX spike episodes to identify whether specific event types (earnings seasons, macro announcements) uniformly drive both variables; (3) extend the time series across multiple years to test whether this r² holds in high-volatility regimes; and (4) introduce control variables such as overall market index returns or other tape volumes to isolate Tape B-specific dynamics from broad market effects.
X dataset: Cboe U.S. Equities Historical Market Volume Data 2014
Y dataset: VIX Daily Index
Part of experiment: Daily - Cboe U.S. Equities Historical Market Volume Data 2014 vs VIX Daily Index