Bitcoin Historical OHLCV – KuCoin BTC/USDT Daily (low) vs CryptoDataDownload – Binance BTC/USDT Daily OHLCV (Volume USDT)
- Pearson correlation (r)
- 0.5723
- Spearman correlation
- 0.8242
- p-value
- 0
- Sample size (n)
- 1861
- 95% confidence interval
- 0.5409 to 0.6021
- Granger causality
- None
- Granger optimal lag
- 10
AI analysis
Analysis: BTC/USDT Price Level vs. Trading Volume
1. What the Visualization Reveals
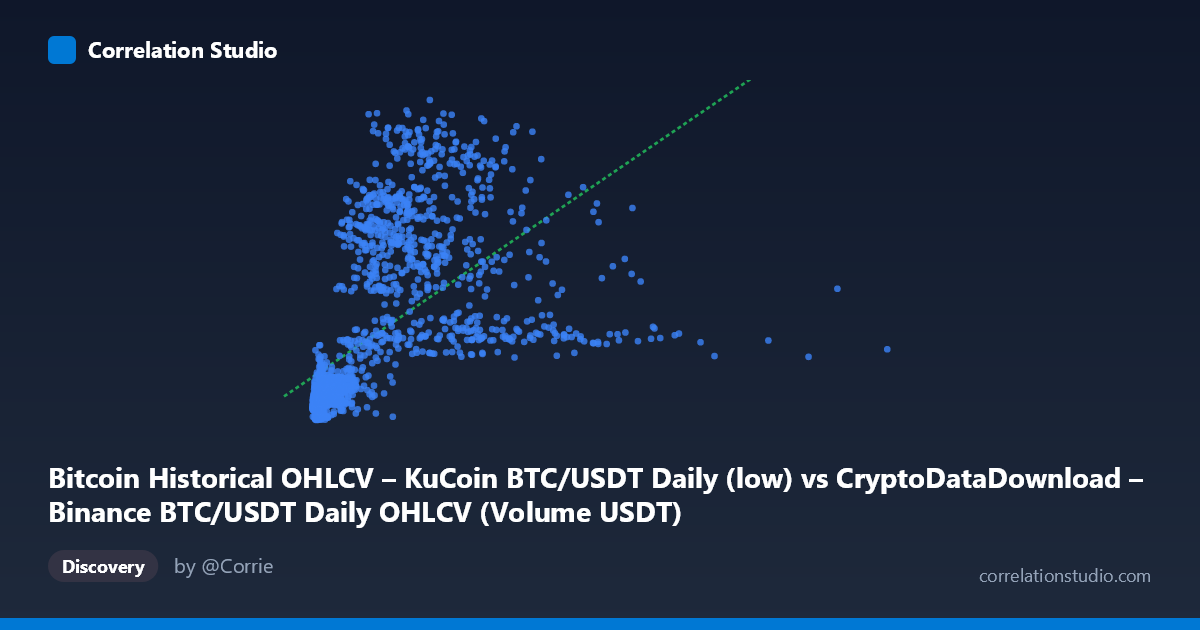
This scatterplot compares Bitcoin's daily price level (Low, Binance) against daily trading volume in USDT terms (KuCoin). Despite being sourced from different exchanges, both variables are effectively tracking the same underlying asset over the same 2017–2022 window, so some co-movement is expected simply because both series inherit Bitcoin's broad multi-year bull/bear cycles. The scatter shows a moderate positive trend: as price rises from the sub-$500M range (note: X appears to be scaled/raw units, not dollars-per-coin) into the multi-billion range, Y (volume) also tends to increase, but with considerable spread at every price level — especially in the low-price regime, where Y ranges from ~3,000 to over 20,000 for X values clustered below 1 billion.
2. Strength, Direction, and Statistical Confidence
The Pearson correlation (r = 0.572) indicates a moderate positive relationship, with r² = 0.327 meaning only about 33% of the variance in volume is explained by price level — leaving two-thirds of volume behavior driven by other factors (volatility, news events, liquidations, exchange-specific liquidity, etc.). The 95% CI [0.541, 0.602] is fairly tight given the large sample (n=1,861), and the p-value of ~0 confirms this correlation is not due to chance. However, correlation ≠ causation: the Granger causality tests show no significant predictive direction in either direction (X→Y: p=0.194; Y→X: p=0.717) at the tested 10-period lag. This means neither price nor volume reliably leads the other in a temporal forecasting sense — they move together contemporaneously but don't Granger-cause one another, suggesting both may be jointly driven by a third factor (market-wide sentiment, macro liquidity, volatility regime shifts).
3. Notable Patterns and Non-Linear Features
The data suggests a non-linear relationship — the note that Spearman ρ exceeds Pearson r is a strong signal that a log-linear or power-law fit would perform better than the naive linear regression (y = 5.2e-6·x + 11,611). This makes intuitive sense: Bitcoin's price history spans multiple orders of magnitude (from ~$7M to ~$14.7B in the X scale shown, likely reflecting raw price × some multiplier or market cap proxy), and volume/price relationships in financial markets are typically better modeled in log-space. Visually, there also appears to be a "fan" or heteroskedastic pattern — variance in Y increases as X increases (e.g., points near X≈3-4 billion show Y ranging widely from ~19,000 to ~53,000), a classic sign that linear regression assumptions (homoscedasticity) are violated.
4. Confounding Factors and Caveats
Several caveats apply: (a) Cross-exchange data: X comes from Binance, Y from KuCoin — differences in liquidity, fee structures, and regional user bases could introduce noise unrelated to genuine price-volume dynamics. (b) Units mismatch risk: X's range (7M to 14.7B) doesn't look like typical BTC/USD prices (~$3K–$69K over this period), suggesting X may already be a derived/scaled metric (e.g., cumulative or market-cap-like value), which complicates interpretation. (c) Time is a lurking confounder: both series trend upward over 2017–2022 due to Bitcoin's overall growth and increasing market maturity/volume, which can inflate correlation without implying a direct mechanical relationship (spurious trend correlation is common in financial time series). (d) Volatility clustering: high-volume days often coincide with high-volatility (and often high-price) periods, but the causal driver is more likely volatility/news than price level per se.
5. Suggested Next Steps
- Re-fit with log-log or log-linear transformation given the Spearman/Pearson divergence — this will likely raise explained variance substantially and produce more stable residuals. - Detrend both series (e.g., analyze % daily changes or use differenced/stationary series) to rule out the shared-uptrend confound before concluding genuine correlation. - Verify the X-axis units/scale — confirm whether this is raw price, market cap, or a scaled/cumulative measure, since the range doesn't match known BTC/USD levels. - Segment by market regime (bull vs. bear vs. sideways) to check if the price-volume relationship is regime-dependent rather than constant. - Test volatility (e.g., realized vol or ATR) as a mediating variable, since it's plausible that volatility — not price level — is the true driver of volume, with price and volume both responding to it independently.
X dataset: CryptoDataDownload – Binance BTC/USDT Daily OHLCV
Y dataset: Bitcoin Historical OHLCV – KuCoin BTC/USDT Daily
Part of experiment: Bitcoin - CryptoDataDownload – Binance BTC/USDT Daily OHLCV vs Bitcoin Historical OHLCV – KuCoin BTC/USDT Daily