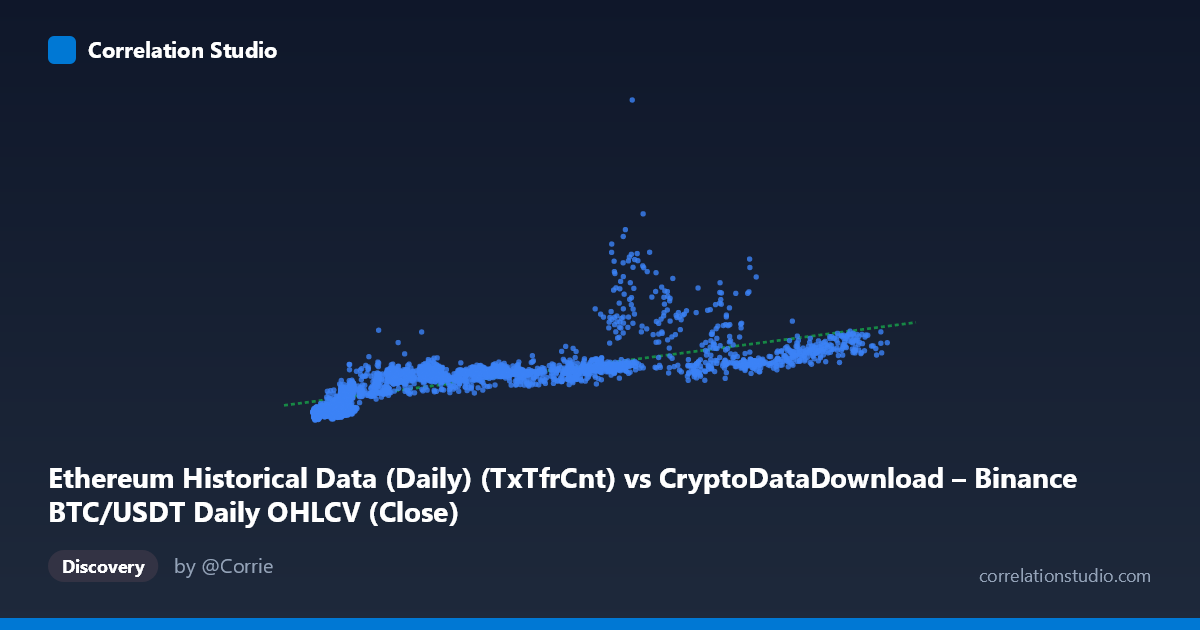
Ethereum Historical Data (Daily) (TxTfrCnt) vs CryptoDataDownload – Binance BTC/USDT Daily OHLCV (Close)
- Pearson correlation (r)
- 0.7555
- Spearman correlation
- 0.9036
- p-value
- 0
- Sample size (n)
- 3191
- 95% confidence interval
- 0.7403 to 0.7701
- Granger causality
- None
- Granger optimal lag
- 10
- Time coverage
- 2017-08-17 to 2026-05-20
AI analysis
Analysis: Ethereum Transaction Count vs. BTC/USDT Close Price
1. Relationship Overview
The scatterplot depicts a positive association between Ethereum's daily transaction count (X) and Bitcoin's daily closing price (Y). As transaction count rises, BTC price tends to rise as well, though the relationship is far from a tight linear band — there's considerable vertical scatter at almost every X value, especially in the mid-range (X ≈ 20,000–90,000), where Y spans from under 200,000 to over 2,500,000. This spread indicates that transaction count alone is a weak-to-moderate predictor of price on any given day.
2. Strength, Direction, and Statistical Context
The Pearson correlation of r = 0.7555 indicates a fairly strong positive linear relationship, but r² = 0.5708 tells the more important story: only about 57% of the variance in BTC price is explained by ETH transaction count, leaving 43% attributable to other factors or noise. The 95% confidence interval [0.740, 0.770] is tight, and the p-value of ~0 confirms this correlation is highly statistically significant — but with n=3,191 daily observations, even modest correlations become "significant," so significance here should not be conflated with practical predictive strength. Critically, the Granger causality tests show no significant predictive direction in either direction (X→Y: p=0.545; Y→X: p=0.624) even at an optimal lag of 10 days. This means neither series reliably leads the other in time — the correlation is likely driven by both variables responding to a common underlying force (e.g., overall crypto market sentiment, adoption cycles, or bull/bear regimes) rather than one causing the other.
3. Notable Patterns and Outliers
Several features stand out: - Fan-shaped scatter: variance in Y increases with X, suggesting heteroscedasticity — at low transaction counts (X < 15,000), prices cluster tightly in low ranges (~200,000–650,000), while at higher X values, price spread widens dramatically. - Vertical clusters at similar X: e.g., multiple points near X≈6,000–13,000 with Y ranging from 200,000 to 800,000+, implying that at low network activity, price is still driven by other regime-dependent factors. - High-Y outliers: points like (66,902, 2,698,591), (81,447, 1,847,022), and (90,628, 1,819,052) sit well above the general trend, likely corresponding to late-cycle bull-market periods where price surged disproportionately to on-chain activity. - Non-linearity flag: the note that Spearman ρ exceeds Pearson r is a strong signal that a monotonic but curved (log or power-law) relationship fits better than a straight line — common in crypto data where both price and activity grow multiplicatively over time.
4. Confounding Factors and Caveats
This is fundamentally a time-series correlation between two trending series, spanning 2017–2026 — a period that includes multiple bull/bear cycles for both BTC and ETH. Both series are likely non-stationary (trending upward over time with structural breaks), which is a classic setup for spurious correlation: two unrelated (or indirectly related) trending series can show high r simply because both increase over a shared timeframe. The lack of Granger causality reinforces this concern — if the relationship is real and causal, we'd expect one to help predict the other beyond its own history. Additionally, mixing an Ethereum on-chain metric with a Bitcoin market price conflates two different assets; any correlation likely reflects broad crypto-market co-movement (both are proxies for overall market cycle/sentiment) rather than a direct mechanical relationship.
5. Recommendations for Further Investigation
- Detrend/difference the data (e.g., use daily % changes or log returns) before correlating, to remove shared trend and test for genuine short-term co-movement. - Test stationarity (ADF/KPSS) on both series; if non-stationary, consider cointegration analysis rather than raw Pearson correlation. - Fit non-linear models (log-log or polynomial regression) given the Spearman/Pearson divergence — a log transform of both variables may substantially improve fit and interpretability. - Segment by market regime (bull vs. bear phases) to check if the correlation strength and slope differ across cycles — the high-Y outliers suggest regime-dependent behavior. - Introduce a third variable — e.g., overall crypto market cap, BTC network activity, or macro liquidity indicators — as a likely common driver to test whether it better explains both series jointly (partial correlation).
X dataset: CryptoDataDownload – Binance BTC/USDT Daily OHLCV
Y dataset: Ethereum Historical Data (Daily)
Part of experiment: Bitcoin - CryptoDataDownload – Binance BTC/USDT Daily OHLCV vs Ethereum Historical Data (Daily)