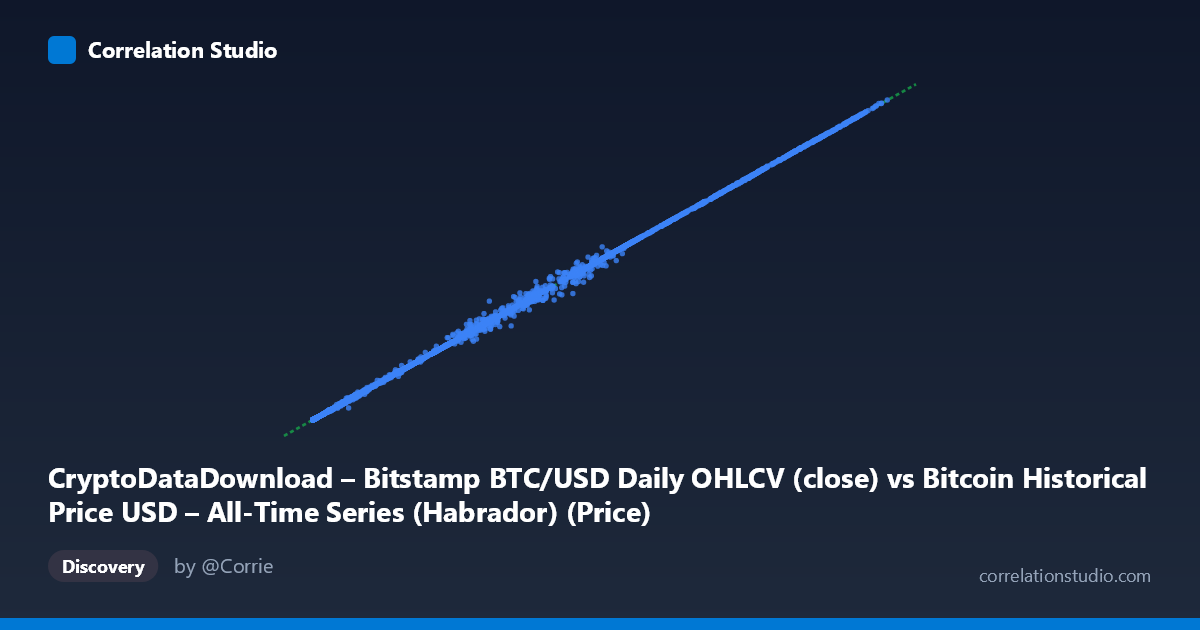
CryptoDataDownload – Bitstamp BTC/USD Daily OHLCV (close) vs Bitcoin Historical Price USD – All-Time Series (Habrador) (Price)
- Pearson correlation (r)
- 0.9998
- Spearman correlation
- 0.9998
- p-value
- 0
- Sample size (n)
- 4170
- 95% confidence interval
- 0.9998 to 0.9998
- Granger causality
- None
- Granger optimal lag
- 10
AI analysis
Analysis: Bitcoin Price Cross-Source Comparison (Habrador vs. Bitstamp)
1. What the Visualization Reveals
This scatterplot compares Bitcoin's daily closing price from two independent data sources — a curated historical dataset (Habrador) and a raw exchange feed (Bitstamp). The points fall almost perfectly along the y = x line (slope ≈ 0.999, intercept ≈ 16.5), which is exactly what should be expected if both datasets are recording the same underlying phenomenon — Bitcoin's market price — rather than two genuinely distinct variables. The data spans BTC's full price history, from sub-$1,000 levels to over $120,000, and the tight linear fit holds consistently across this entire multi-order-of-magnitude range.
2. Strength, Direction, and Statistical Meaning
The correlation is essentially maximal (r = 0.9998, r² = 0.9996), meaning 99.96% of the variance in one series is explained by the other. The 95% CI [0.9998, 0.9998] is vanishingly narrow, and p ≈ 0 confirms this relationship is not due to chance — though with n = 4,170 daily observations of the same asset, statistical significance here is almost guaranteed regardless of relationship strength. Practically, this r² means the two series are near-duplicates of each other numerically, not that one meaningfully "predicts" or "drives" the other in a causal sense. This is reinforced by the Granger causality test: neither direction (X→Y or Y→X) shows significant predictive lead (p = 0.51 and p = 0.48), meaning neither price series leads the other in time. This is the expected signature of two sensors measuring the same event simultaneously — there's no lag structure because there's no real temporal precedence to detect.
3. Notable Patterns and Outliers
The relationship is highly linear across the full magnitude range, with no visible curvature, heteroscedasticity fanning, or regime breaks — a strong sign of genuine same-asset tracking rather than a spurious macro correlation. However, several sample points show meaningful deviations from the 1:1 line, notably: (31,659.54, 32,545.26), (21,310.66, 22,814.24), (5,884.34, 6,493.51), (48,907.53, 46,856.29), and (9,917.25, 9,546.56) — deviations of several percent. These likely correspond to periods of high volatility or exchange-specific price divergence (e.g., during flash crashes, low-liquidity periods, or exchange-specific stress events like the Bitstamp/Mt. Gox era or COVID-crash days) where different exchanges' closing prices briefly decoupled. Small-value points near the origin (e.g., ~$230–450) also show proportionally larger relative discrepancies, consistent with wider bid-ask spreads and thinner markets in Bitcoin's early years (2014-2015).
4. Confounders and Caveats
The central caveat is that this is not two independent variables — it's the same underlying asset price recorded via two different pipelines/exchanges/methodologies. High correlation here reflects measurement consistency, not a substantive economic or causal relationship. Confounders to consider: (a) timestamp/timezone misalignment between "Date" conventions in the two sources could introduce small lead/lag noise, especially around daily close boundaries; (b) Bitstamp-specific liquidity events (exchange outages, regulatory actions, or the 2014-2016 low-volume period) could create genuine price divergence from the Habrador aggregate/composite source; (c) if Habrador's series is itself sourced partly from Bitstamp or a blend of exchanges, this could mechanically inflate the correlation further (data leakage rather than independent validation).
5. Actionable Insights
Given r² ≈ 1 and no Granger-causal lead-lag, treat this relationship as a data-quality/reconciliation check rather than a forecasting signal — the two series should be interpreted as redundant measurements of Bitcoin price, useful for cross-validating dataset integrity. Next steps: (1) investigate the handful of large-residual points (e.g., the ~3-5% deviations noted above) to determine if they reflect genuine exchange divergence or a data/timestamp alignment bug; (2) examine whether residuals cluster around specific date ranges (especially early, illiquid 2014-2015 data) to flag periods where one source may be less reliable; (3) if the goal is genuine multi-exchange arbitrage or lead-lag analysis, use higher-frequency (intraday) data rather than daily closes, since daily granularity is too coarse to detect the sub-day lead-lag dynamics that might exist between exchanges.
X dataset: Bitcoin Historical Price USD – All-Time Series (Habrador)
Y dataset: CryptoDataDownload – Bitstamp BTC/USD Daily OHLCV
Part of experiment: Bitcoin - Bitcoin Historical Price USD – All-Time Series (Habrador) vs CryptoDataDownload – Bitstamp BTC/USD Daily OHLCV