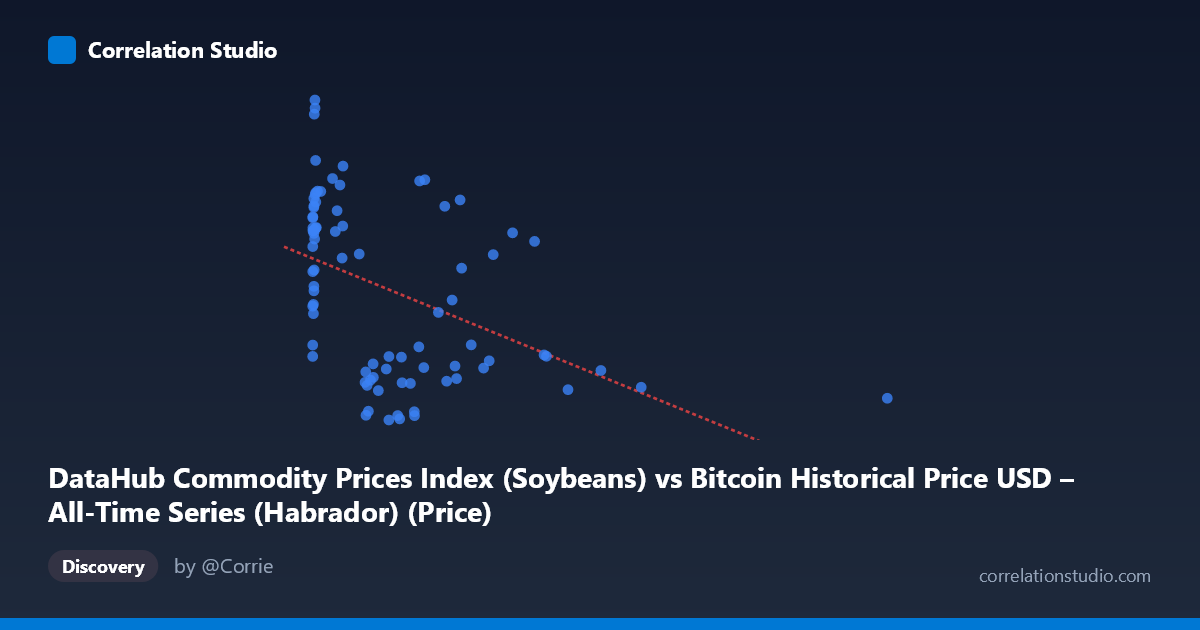
DataHub Commodity Prices Index (Soybeans) vs Bitcoin Historical Price USD – All-Time Series (Habrador) (Price)
- Pearson correlation (r)
- -0.4471
- Spearman correlation
- -0.4437
- p-value
- 0.000023
- Sample size (n)
- 83
- 95% confidence interval
- -0.6045 to -0.256
- Granger causality
- None
- Granger optimal lag
- 10
AI analysis
Analysis: Soybean Price Index vs. Bitcoin Price
1. Relationship Overview
The scatterplot displays a modest negative association between the soybean commodity price index (X) and Bitcoin's historical USD price (Y). Most data points cluster tightly in the lower-left region (X < 300, Y between 320-620), with a sparse, long tail of points extending rightward to X ≈ 2452. This heavy left-skew in X creates a visualization dominated by a dense cloud near the origin, with a handful of high-X outliers pulling the regression line's slope downward.
2. Strength, Direction, and Statistical Confidence
The correlation coefficient (r = -0.4471) indicates a moderate negative relationship, but r² = 0.1999 reveals that only ~20% of the variance in Bitcoin price is explained by soybean price index movements — leaving 80% attributable to other factors. The 95% CI [-0.6045, -0.2560] is reasonably wide but stays entirely negative, and the p-value (2.267E-05) confirms this correlation is statistically significant and unlikely due to chance alone. However, statistical significance here reflects a real but weak linear pattern, not a strong predictive relationship. Critically, the Granger causality tests show no significant predictive direction in either direction (X→Y: p=0.354; Y→X: p=0.269), meaning neither variable's past values reliably forecast the other's future movements at the tested lag structure. This strongly suggests the correlation is coincidental or driven by a shared external trend rather than genuine causal linkage.
3. Notable Patterns and Outliers
The data shows a distinctive bimodal clustering: a dense cluster of ~60 points with X < 250 and Y ranging widely (320-620), and a sparser scatter of ~20 points with X 500 where Y values compress into a narrower, lower band (340-530). The extreme outlier at X=2452.18, Y=339.73 has substantial leverage on the regression slope. Within the low-X cluster, Y values span almost the entire range independently of X, suggesting near-random variation at low soybean index values — this is where most non-linear "noise" resides. There's little evidence of a curved or non-linear relationship; the pattern looks more like two overlapping regimes with different variances than a smooth continuous trend.
4. Confounding Factors and Caveats
This pairing is inherently suspect: Bitcoin's price history (2010-2017) captures a period of exponential growth driven by adoption, speculation, and market maturation — a trend having nothing to do with soybean agricultural markets. Any correlation is likely a spurious artifact of time-trending series (Bitcoin trending upward over years, soybean index following its own commodity-driven fluctuations). Both series may be independently correlated with broader macroeconomic cycles (USD strength, global liquidity, inflation expectations) without directly influencing each other. The small sample (n=83 paired from N=449) and uneven time-sampling could also distort the apparent relationship.
5. Recommendations
Given the lack of Granger causality and the likely spurious nature of this correlation, further investigation should test for common trend/unit-root effects (e.g., cointegration tests, detrending both series before correlating) rather than relying on raw Pearson correlation. Analysts should also examine whether both series are proxying for a third variable (e.g., global risk sentiment or dollar valuation). Given r² of only 20%, this relationship offers negligible practical predictive value for trading or forecasting purposes — soybean prices should not be treated as a Bitcoin price indicator without much stronger causal evidence.
X dataset: Bitcoin Historical Price USD – All-Time Series (Habrador)
Y dataset: DataHub Commodity Prices Index
Part of experiment: Bitcoin - Bitcoin Historical Price USD – All-Time Series (Habrador) vs DataHub Commodity Prices Index