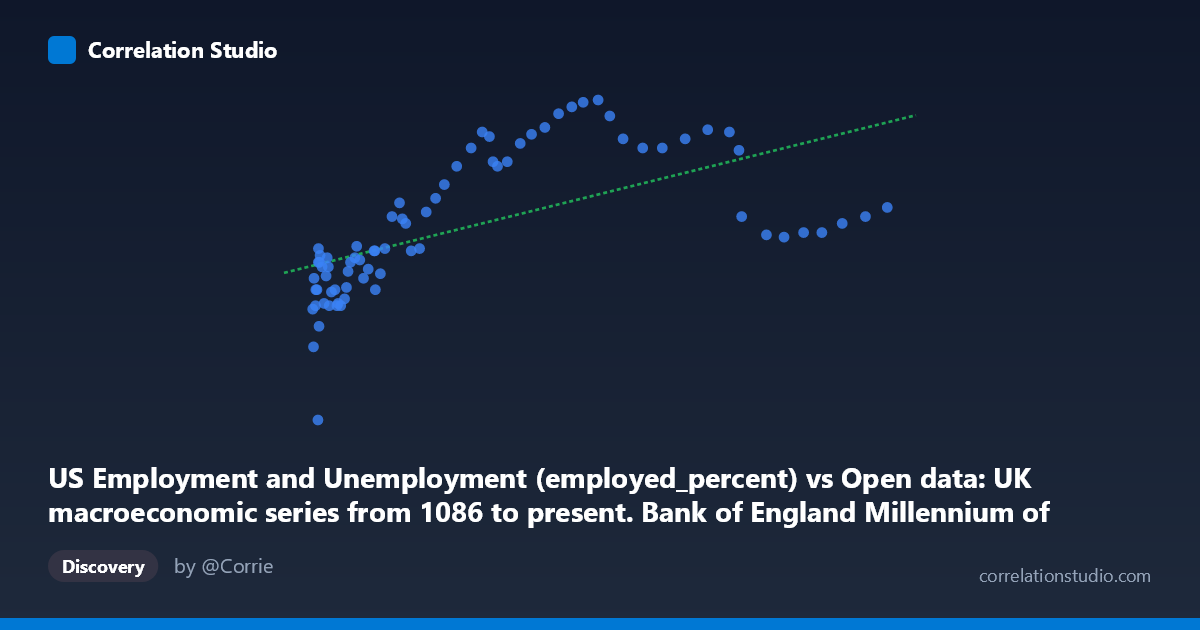
US Employment and Unemployment (employed_percent) vs Open data: UK macroeconomic series from 1086 to present. Bank of England Millennium of Macroeconomic Data. (Year) (value)
- Pearson correlation (r)
- 0.6025
- Spearman correlation
- 0.8033
- p-value
- 0
- Sample size (n)
- 76
- 95% confidence interval
- 0.4363 to 0.7289
- Granger causality
- None
- Granger optimal lag
- 1
- Time coverage
- 1941-01-01 to 2016-01-01
AI analysis
Analysis of US Employment Rate vs. UK Macroeconomic Series Correlation
1. What the Visualization Reveals
The scatterplot displays a moderate positive relationship between US employment percentage (X-axis) and a UK macroeconomic variable — likely UK life expectancy or a similar demographic/welfare index given the Y-axis range of roughly 50–64 — drawn from the Bank of England's Millennium of Macroeconomic Data. As US employment rises from approximately 33,000 to 468,000 (likely in thousands or a scaled index), the UK variable tends to increase from around 50–55 to the low-to-mid 60s. The cloud of points shows a discernible upward trend, though with considerable scatter, particularly at lower X values where the data is densely clustered and at higher X values where dispersion becomes notable.
2. Correlation Strength, Direction, and Statistical Framing
The Pearson correlation of r = 0.60 indicates a moderate positive association, but the more meaningful metric is r² = 0.363, meaning only 36.3% of the variance in the UK measure is statistically explained by US employment levels — leaving nearly two-thirds of variation unexplained by this relationship alone. The 95% confidence interval of [0.44, 0.73] is reasonably tight and entirely positive, confirming directional reliability, and the p-value of 8.5 × 10⁻⁹ makes this association highly statistically significant, ruling out chance as an explanation given n = 76 paired observations. However, Granger causality tests reveal no significant predictive temporal direction in either direction (X→Y: F = 1.10, p = 0.298; Y→X: F = 1.62, p = 0.208), meaning that past values of US employment do not reliably predict future values of the UK variable, and vice versa. This is a critical caveat: statistical correlation exists, but neither series demonstrably leads the other in time.
3. Notable Patterns, Clusters, and Outliers
Several structural features stand out. There is a dense cluster of low-X, low-Y observations (X < 100,000, Y ≈ 53–58), likely corresponding to earlier decades (1940s–1960s) when both US employment figures and the UK metric were lower. A second, more dispersed upper cluster (X = 150,000–350,000, Y = 61–64.5) likely reflects later decades of simultaneous improvement in both series. There are notable outliers: the point near (37,274, 50.40) sits well below the main cluster's Y values for its X range, suggesting an anomalous year; similarly, several high-X observations (390,000) yield relatively modest Y values (58–60), pulling against the trend and suggesting diminishing returns or structural divergence at high employment levels. The Spearman ρ exceeding Pearson r further confirms the relationship is non-linear — a logarithmic or piecewise fit would likely better capture the pattern of rapid Y growth at lower X values that plateaus at higher X values.
4. Confounding Factors and Interpretive Caveats
The most fundamental caveat is that both series are strongly time-trended — US employment and the UK variable (plausibly life expectancy) both increased secularly across the 20th century for largely independent structural reasons (medical advances, economic development, post-war recovery). This means the observed correlation may largely be a spurious consequence of shared temporal trend rather than any genuine causal or economic linkage between US labor markets and UK welfare outcomes. Confounding variables almost certainly include time itself, global GDP growth, technological progress, post-WWII institutional development, and shared geopolitical shocks affecting both economies simultaneously. The cross-national nature of this comparison makes direct causal inference particularly tenuous — mechanisms linking US employment rates to a UK macroeconomic index would need careful theoretical grounding. The dataset's long time span (1941–2016) also means structural breaks likely exist within both series.
5. Actionable Insights and Further Investigation
Given the non-linear signal flagged by the Spearman-Pearson divergence, a logarithmic regression (y = a·ln(x) + b) or polynomial fit should be tested and compared against the linear model using AIC/BIC criteria. More critically, detrending both series (via first-differencing or HP filtering) before computing correlation would test whether the association survives removal of common temporal trend — this is essential to determining whether the relationship is substantive or spurious. Investigating the outlier at (37,274, 50.40) and the high-X plateau observations could reveal specific historical episodes (e.g., wartime anomalies, recessions) that merit separate treatment. Researchers should also explore multilateral economic linkages — such as global trade volumes or synchronized business cycles — as potential mediating variables, and consider vector autoregression (VAR) models with additional controls rather than relying on bivariate Granger tests alone.
X dataset: Open data: UK macroeconomic series from 1086 to present. Bank of England Millennium of Macroeconomic Data. (Year)
Y dataset: US Employment and Unemployment
Part of experiment: Yearly - Open data: UK macroeconomic series from 1086 to present. Bank of England Millennium of Macroeconomic Data. (Year) vs US Employment and Unemployment