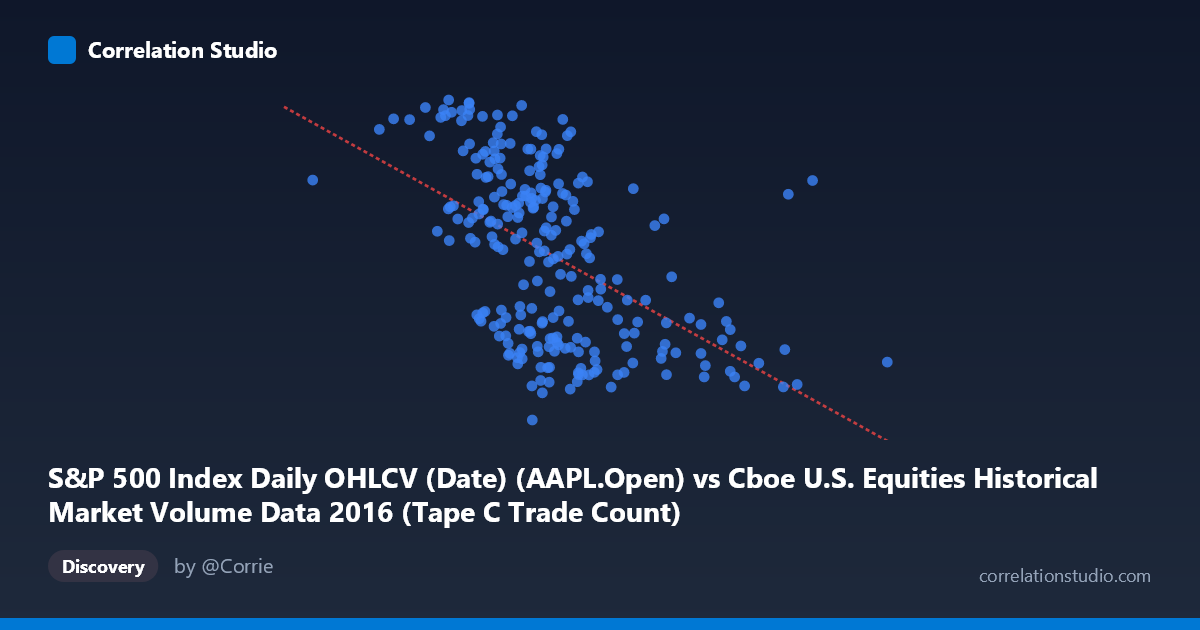
S&P 500 Index Daily OHLCV (Date) (AAPL.Open) vs Cboe U.S. Equities Historical Market Volume Data 2016 (Tape C Trade Count)
- Pearson correlation (r)
- -0.5167
- Spearman correlation
- -0.5467
- p-value
- 0
- Sample size (n)
- 252
- 95% confidence interval
- -0.6018 to -0.4199
- Granger causality
- None
- Granger optimal lag
- 1
AI analysis
Analysis: AAPL Opening Price vs. Cboe Tape C Trade Count (2016)
Relationship Overview The scatterplot reveals a moderate negative relationship between Apple's (AAPL) daily opening price on the S&P 500 and the Cboe U.S. Equities Tape C trade count across 2016. As AAPL's opening price increases, the number of Tape C trades tends to decrease. The linear regression equation (y = -2.68057E-05x + 123.63) reflects this downward slope, suggesting that for every ~37,300-unit increase in AAPL's opening price, the Tape C trade count decreases by approximately 1 unit. The relationship is visible but far from deterministic, with considerable scatter around the regression line across the full price range of roughly $278K to $1.32M (likely representing scaled or notional values).
Correlation Strength and Statistical Significance The Pearson correlation of r = -0.517 indicates a moderate negative association, and the R² of 0.267 means that AAPL's opening price explains only about 26.7% of the variance in Tape C trade counts — leaving nearly three-quarters of the variability unexplained by this relationship alone. The 95% confidence interval of [-0.60, -0.42] is reasonably tight and entirely negative, confirming the inverse direction with good reliability. The p-value of effectively zero (p ≈ 0) across n = 252 paired observations strongly rejects the null hypothesis of no correlation. However, the Granger causality tests show no significant predictive directionality in either direction (X→Y: F = 1.60, p = 0.207; Y→X: F = 0.49, p = 0.486), meaning that while the two series are contemporaneously correlated, neither reliably predicts the other in a lagged, temporal sense. This is a critical distinction: correlation exists, but there is no evidence of a leading-lagging causal mechanism at a 1-period lag.
Notable Patterns, Clusters, and Outliers The sample points reveal several noteworthy features. There is a dense cluster of observations in the X range of roughly 580,000–800,000, where trade counts span broadly from ~90 to ~118 — suggesting high variability in Tape C activity even when AAPL prices are relatively stable. A handful of high-X outliers (e.g., ~990,202 at y = 93.79 and ~1,023,027 at y = 97.06) sit in the lower-right region, consistent with the negative trend but appearing somewhat isolated from the main cluster. Conversely, several low-X, high-Y points (e.g., ~519,410 at y = 116.80 and ~504,690 at y = 106.62) anchor the upper-left, reinforcing the inverse pattern. There is also notable vertical spread at any given X value (e.g., near X ≈ 650,000–700,000, Y values range from ~90 to ~115), suggesting substantial noise or other drivers not captured here.
Confounding Factors and Caveats Several important caveats apply. First, the axis label swap noted in the dataset descriptions (X is labeled from the AAPL OHLCV dataset as an opening price column, yet the scale of ~$278K–$1.32M is inconsistent with typical AAPL 2016 prices of ~$90–$130) strongly suggests these may be notional or aggregated volume values, not raw per-share prices — requiring careful reinterpretation. Second, both series are time-indexed over 2016, meaning any shared macroeconomic trends (e.g., post-Brexit volatility in mid-2016, year-end seasonality) could induce spurious correlation through common temporal drivers. Third, Tape C trade count is a market-wide measure, so its correlation with a single stock's metric may reflect broad market activity levels rather than any stock-specific dynamic. Finally, with only a 1-period Granger lag tested, longer lags may yield different causality conclusions.
Actionable Insights and Further Investigation Given the moderate but statistically robust correlation, several avenues merit exploration. Decomposing the time series (e.g., removing seasonal or trend components) before computing correlations would help isolate whether the relationship is genuine or trend-driven. Researchers should test Granger causality at multiple lags (e.g., 2–10 periods) to ensure the 1-period result is not artificially masking predictive relationships. It would also be valuable to compare AAPL specifically against other Tape C-listed names to determine whether this inverse relationship is stock-specific or a proxy for broader market conditions. Finally, incorporating VIX or overall market volume as a covariate in a multivariate model could clarify how much of the 73.3% unexplained variance is attributable to market-wide volatility regimes versus AAPL-idiosyncratic factors.
X dataset: Cboe U.S. Equities Historical Market Volume Data 2016
Y dataset: S&P 500 Index Daily OHLCV (Date)
Part of experiment: Daily - Cboe U.S. Equities Historical Market Volume Data 2016 vs S&P 500 Index Daily OHLCV (Date)