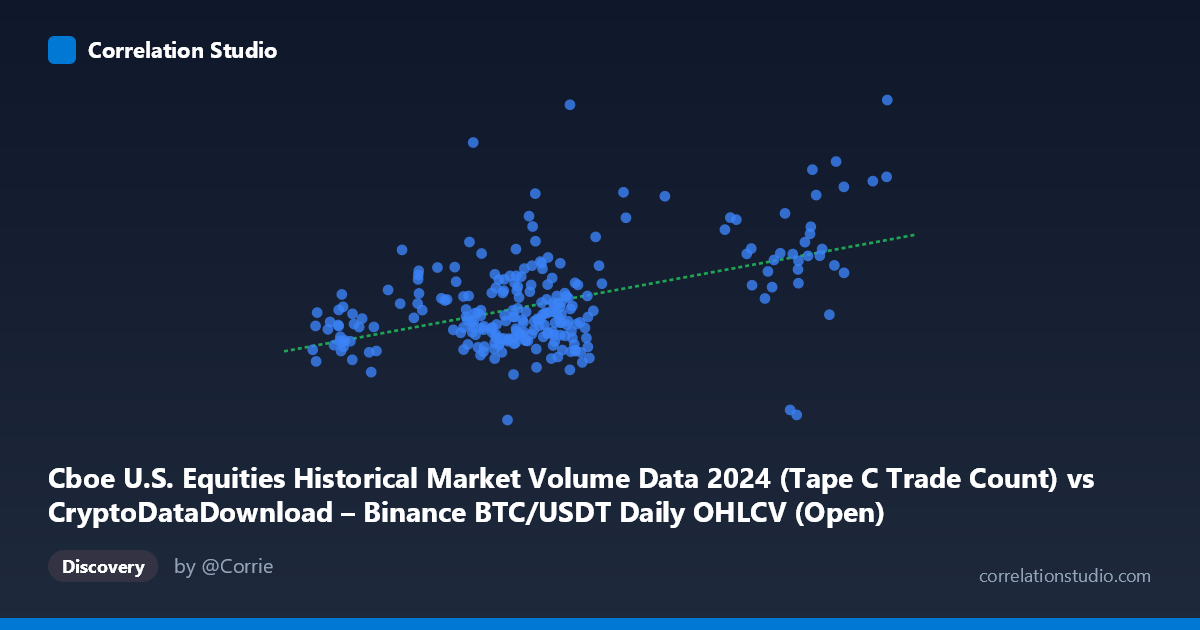
Cboe U.S. Equities Historical Market Volume Data 2024 (Tape C Trade Count) vs CryptoDataDownload – Binance BTC/USDT Daily OHLCV (Open)
- Pearson correlation (r)
- 0.4848
- Spearman correlation
- 0.336
- p-value
- 0
- Sample size (n)
- 252
- 95% confidence interval
- 0.3842 to 0.5739
- Granger causality
- None
- Granger optimal lag
- 10
AI analysis
Analysis: Cboe Tape C Trade Count vs. BTC/USDT Opening Price
1. Relationship Overview
The scatterplot shows a positive but noisy association between Cboe U.S. equities Tape C trade counts and Bitcoin's daily opening price on Binance. Most data points cluster in a fairly tight band — X values between roughly 55,000–72,000 and Y values between 1,600,000–2,400,000 — with a smaller number of higher-X outliers (94,000–101,000) that pull the trend line upward. Within the dense cluster, the relationship looks weak and diffuse; the visual signal is driven substantially by the handful of high-volume trade-count days.
2. Strength, Direction, and Statistical Confidence
The correlation coefficient (r = 0.4848) indicates a moderate positive linear relationship, but r² = 0.235 tells the more important story: only about 23.5% of the variance in BTC's opening price is explained by Tape C trade count, leaving roughly 76.5% unexplained by this single variable. The 95% CI [0.384, 0.574] is reasonably tight and excludes zero, and the p-value (2.22e-16) confirms this correlation is highly unlikely to be due to chance in this sample. However, statistical significance here reflects the large effective sample size, not necessarily practical predictive power — a moderate r with low r² means the relationship is real but not strong enough for reliable point-forecasting.
Critically, the Granger causality tests show no significant predictive relationship in either direction (X→Y: p=0.313; Y→X: p=0.426) at the optimal lag of 10 periods. This means that despite the contemporaneous correlation, neither series helps forecast future values of the other over time. The correlation is likely a same-day co-movement (or shared trend/seasonality) rather than a causal or lead-lag dynamic — an important distinction for anyone hoping to use one series as a leading indicator for the other.
3. Notable Patterns and Outliers
Several points deviate sharply from the main cluster: - (58161, 2801223) — a low trade count paired with an unusually high BTC price, a clear vertical outlier. - (62135, 1260223) — sits at the minimum Y value despite a mid-range X, another vertical outlier. - (94881, 1316055) — high trade count but low BTC price, breaking the positive trend and suggesting the upward slope is not robust to this point. - The cluster of high-X points (94,000–101,000) mostly aligns with elevated Y values (2.0M–2.4M), which is largely responsible for generating the positive slope; without these points, the relationship within the dense low-X cluster would look nearly flat or diffuse.
This pattern suggests a potential non-linear or threshold effect: trade count may only relate to BTC price during specific high-activity trading days, with no discernible relationship during typical days.
4. Confounders and Caveats
This is a classic case of comparing two unrelated markets (U.S. equities trade activity vs. crypto price) that may simply share common macro drivers — such as overall market risk appetite, liquidity conditions, Fed policy, or calendar effects (e.g., month-end, quarter-end rebalancing) — without any direct mechanical link. Both series are also time-ordered (daily, 2024), meaning they could share trends or autocorrelation that inflates the Pearson r without reflecting genuine covariation. Additionally, the "n=252 vs. N=3,212" discrepancy suggests heavy subsampling (every ~13th observation), which could introduce selection artifacts, and the presence of a few extreme leverage points (especially in the high-X region) means the reported r and regression slope are likely sensitive to those specific days.
5. Suggestions for Further Investigation
- Remove/isolate outliers (especially the three flagged above) and recheck r² to see how much of the correlation is leverage-driven versus genuine. - Test for a shared confounding variable, such as VIX, overall market volume, or macro news events, using partial correlation or multivariate regression. - Examine sub-periods or regimes (e.g., high-volatility months) since the relationship may be non-stationary or concentrated in specific weeks. - Given the null Granger causality result, avoid using Tape C trade count as a forecasting input for BTC price (or vice versa) in trading models — treat the correlation as coincidental/contemporaneous rather than predictive. - If a mechanistic link is hypothesized (e.g., institutional flows into both equities and crypto), consider higher-frequency (intraday) data to test for lead-lag effects at shorter horizons than the 10-day lag tested here.
X dataset: CryptoDataDownload – Binance BTC/USDT Daily OHLCV
Y dataset: Cboe U.S. Equities Historical Market Volume Data 2024
Part of experiment: Bitcoin - CryptoDataDownload – Binance BTC/USDT Daily OHLCV vs Cboe U.S. Equities Historical Market Volume Data 2024