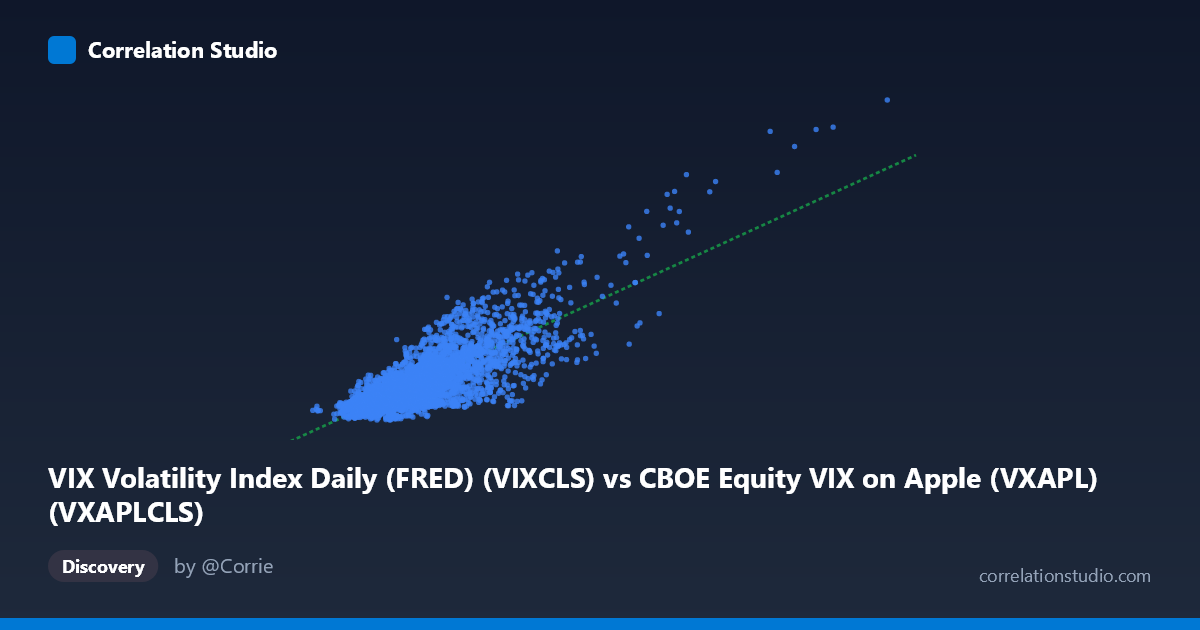
VIX Volatility Index Daily (FRED) (VIXCLS) vs CBOE Equity VIX on Apple (VXAPL) (VXAPLCLS)
- Pearson correlation (r)
- 0.7983
- Spearman correlation
- 0.7352
- p-value
- 0
- Sample size (n)
- 4128
- 95% confidence interval
- 0.787 to 0.8091
- Granger causality
- None
- Granger optimal lag
- 1
- Time coverage
- 2010-06-01 to 2026-10-27
- Recomputed on refreshed data
- 2026-10-29 (r was 0.7983)
AI analysis
VIX vs. VXAPL Correlation Analysis
Relationship Overview
The scatterplot reveals a strong positive linear relationship between the CBOE VIX (S&P 500 implied volatility) and Apple's equity VIX (VXAPL), which is broadly expected given that Apple — as one of the largest components of the S&P 500 — should exhibit volatility dynamics closely tied to broader market sentiment. The regression line y = 0.678x − 1.901 indicates that for every one-point increase in the Apple VIX, the market VIX rises by approximately 0.68 points. The negative intercept suggests that at very low Apple volatility levels, the VIX would theoretically be suppressed below zero, which is a boundary artifact of linear modeling rather than a meaningful economic signal. The data cloud is reasonably well-organized around this line across the bulk of the observed range (roughly 20–45 on the X-axis), confirming that the linear model captures the dominant structural pattern in the data.
Correlation Strength and Statistical Confidence
The Pearson correlation of r = 0.7987 reflects a strong positive association, and the R² of 0.638 means that approximately 63.8% of the variance in the VIX is explained by movements in VXAPL — a substantial but incomplete explanation, leaving over a third of VIX variation driven by other factors. The 95% confidence interval of [0.787, 0.810] is notably narrow given the large sample (n = 4,021), indicating very high precision in this estimate, and the p-value of effectively zero rules out any possibility of this correlation arising by chance. However, the Granger causality results complicate the narrative: neither direction shows statistically significant predictive power at the 5% threshold. The X→Y F-statistic (F = 3.17, p = 0.075) is marginally suggestive but falls short, while Y→X (F = 0.005, p = 0.942) is essentially null. This means that while the two series move together strongly in level, neither reliably leads the other in time — they are largely contemporaneous responses to common shocks rather than one driving the other.
Patterns, Clusters, and Outliers
The sample points reveal a dense core cluster between roughly X = 20–35 and Y = 12–25, consistent with the means (X̄ ≈ 29.9, Ȳ ≈ 18.4), where the relationship appears tight and well-behaved. However, several notable outliers emerge at higher volatility regimes — points such as (57.48, 37.56), (49.15, 28.65), (45.31, 30.12), and (42.92, 12.43) suggest that the relationship becomes more dispersed during elevated volatility episodes. Particularly striking is the point (42.92, 12.43), where Apple's implied volatility is elevated but the broad market VIX is unusually low — a potential idiosyncratic Apple event (e.g., earnings, product announcement, or legal news) driving VXAPL without systemic market stress. The upper-right cluster of high-volatility points likely corresponds to market stress periods (e.g., COVID-19 March 2020, late 2022 rate shock), where both indices spike together but with greater scatter, hinting at possible heteroscedasticity — variance expanding at higher volatility levels.
Confounding Factors and Caveats
Several important caveats apply. First, reverse causality is structurally ambiguous: Apple constitutes roughly 6–7% of the S&P 500 by weight, meaning VXAPL movements partially feed into VIX by construction, creating a built-in correlation that is mechanical rather than purely informational. Second, common drivers — macro events, Fed policy shifts, geopolitical shocks — simultaneously inflate both indices, making it difficult to disentangle the Apple-specific signal from the market-wide signal. Third, the dataset spans 2010–2026, encompassing dramatically different volatility regimes (post-GFC calm, COVID spike, inflation shock), meaning the correlation structure may not be stationary across time; pooling all periods into a single r value may mask regime-specific behavior. Finally, the heteroscedasticity visible in the upper tail means standard OLS assumptions may be violated, potentially inflating confidence in the regression fit.
Actionable Insights and Further Investigation
Given the strong contemporaneous correlation but absent Granger causality, practitioners should avoid using either index as a predictive leading indicator for the other in short-term trading strategies — the relationship is synchronous, not anticipatory. A logical next step would be to decompose the correlation by market regime (e.g., VIX below 20 vs. above 30) to test whether the relationship strengthens or breaks down under stress. Investigating the residuals from the regression — particularly the outlier at (42.92, 12.43) and similar divergences — could identify periods of genuine Apple-idiosyncratic risk that is decoupled from market fear, which carries its own trading or hedging implications. Additionally, fitting a log-log or power-law model may better capture the non-linear behavior in the tails, and a rolling-window correlation analysis could reveal whether this relationship has been strengthening or weakening over the 2010–2026 period as Apple's market cap dominance has grown.
X dataset: CBOE Equity VIX on Apple (VXAPL)
Y dataset: VIX Volatility Index Daily (FRED)
Part of experiment: Daily - CBOE Equity VIX on Apple (VXAPL) vs VIX Volatility Index Daily (FRED)