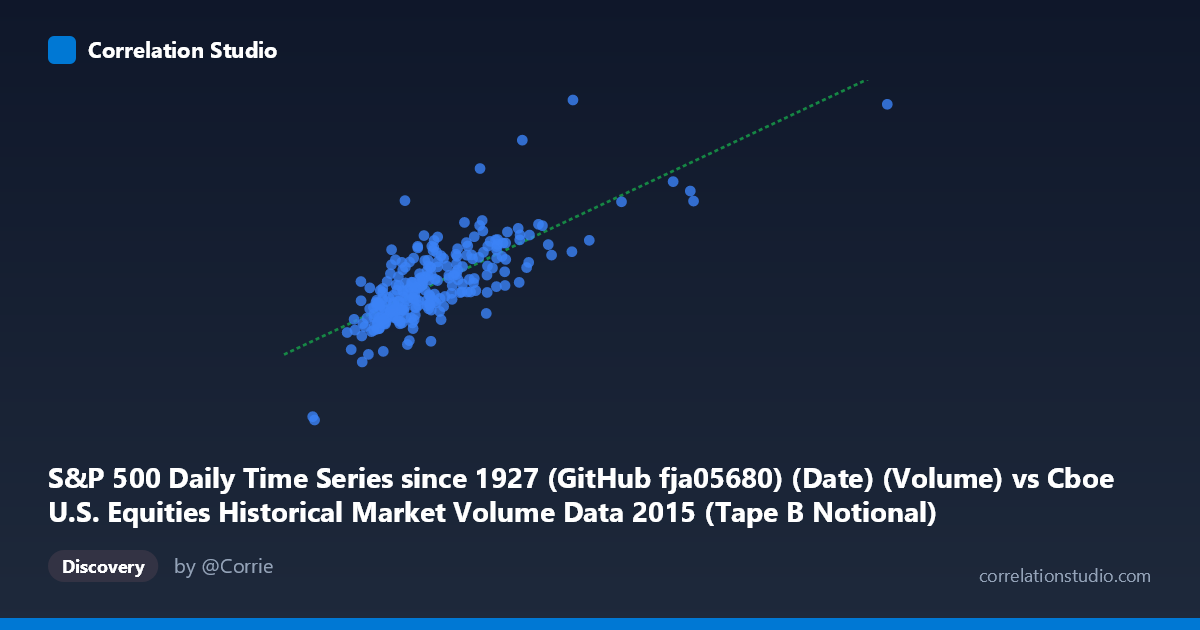
S&P 500 Daily Time Series since 1927 (GitHub fja05680) (Date) (Volume) vs Cboe U.S. Equities Historical Market Volume Data 2015 (Tape B Notional)
- Pearson correlation (r)
- 0.7619
- Spearman correlation
- 0.7421
- p-value
- 0
- Sample size (n)
- 252
- 95% confidence interval
- 0.7047 to 0.8093
- Granger causality
- None
- Granger optimal lag
- 10
AI analysis
Analysis: S&P 500 Trading Volume vs. Cboe Tape B Notional Value (2015)
Relationship Overview The scatterplot reveals a moderately strong positive relationship between total U.S. equities market trading volume (X-axis, measured in shares) and Cboe Tape B notional value (Y-axis, measured in dollars) across 252 trading days in 2015. As overall market volume increases, the notional dollar value traded on Tape B exchanges rises in a broadly linear fashion, which is intuitively sensible — higher share turnover in the broader market tends to coincide with greater dollar-denominated activity on regional exchange venues. However, the relationship is not tight, and considerable scatter around the regression line (y = 0.283x + 2.11B) suggests that volume alone is far from a complete predictor of notional value.
Correlation Strength and Statistical Significance The Pearson correlation of r = 0.762 indicates a meaningful positive association, but the explanatory power is more soberly captured by r² = 0.581 — meaning roughly 58% of the variance in Tape B notional value is explained by overall market volume, leaving 42% attributable to other factors. The 95% confidence interval of [0.705, 0.809] is relatively narrow given the sample of 252 days, and the p-value of effectively zero confirms the result is not a statistical artifact. That said, the Granger causality tests reveal no significant temporal predictive direction in either direction (X→Y: F=1.23, p=0.273; Y→X: F=1.78, p=0.066). This is a critical caveat: while the two series move together contemporaneously, neither reliably predicts the other at a 10-period lag, suggesting they respond to common underlying drivers rather than one causing the other.
Patterns, Clusters, and Outliers The bulk of observations cluster in a relatively compact region — roughly 3B–7B shares in volume and $2.5B–$4.5B in notional value — forming a dense core around the regression line. However, several notable outliers appear in the upper-right quadrant, with X values exceeding 12B shares and Y values approaching $5–5.2B, sitting well above the main cluster. These high-volume, high-notional days likely correspond to identifiable market events (e.g., August 2015 flash crash, Fed announcement days, or index rebalancing events). A point near (2.18B, $1.41B) in the lower-left is a clear low-activity outlier. There is also a faint suggestion of heteroscedasticity — variance in Y appears to increase as X grows — which could slightly undermine standard linear regression assumptions.
Confounding Factors and Caveats Several confounds complicate a straightforward interpretation. First, price levels directly drive notional value independent of volume — a high-volume day with lower average prices produces less notional than a moderate-volume day with elevated prices. Second, Tape B specifically covers NYSE American and regional exchanges, so its notional value is also sensitive to compositional shifts in which securities trade there, not just aggregate market activity. Third, the dataset spans only one calendar year (2015), which includes specific regime changes (rate hike expectations, China volatility spillovers) that may have amplified co-movement in ways not generalizable. Finally, the X-axis label references S&P 500 dates matched to Cboe volume data — any date-alignment imprecision in the dataset join could introduce noise.
Actionable Insights and Further Investigation Practitioners monitoring Tape B liquidity conditions could use overall market volume as a rough real-time proxy for notional activity, but should not rely on it exclusively given the 42% unexplained variance. To improve the model, it would be worthwhile to incorporate intraday price levels or VIX as additional regressors, which would likely capture much of the residual variance. Investigating the high-volume outlier days individually could reveal whether event-driven spikes disproportionately affect Tape B relative to other tapes — a finding relevant for exchange routing and liquidity risk management. Extending the analysis across multiple years would test whether the r = 0.76 relationship is stable or regime-dependent, and applying a rolling-window correlation would expose any structural breaks around market stress periods.
X dataset: Cboe U.S. Equities Historical Market Volume Data 2015
Y dataset: S&P 500 Daily Time Series since 1927 (GitHub fja05680) (Date)
Part of experiment: Daily - Cboe U.S. Equities Historical Market Volume Data 2015 vs S&P 500 Daily Time Series since 1927 (GitHub fja05680) (Date)