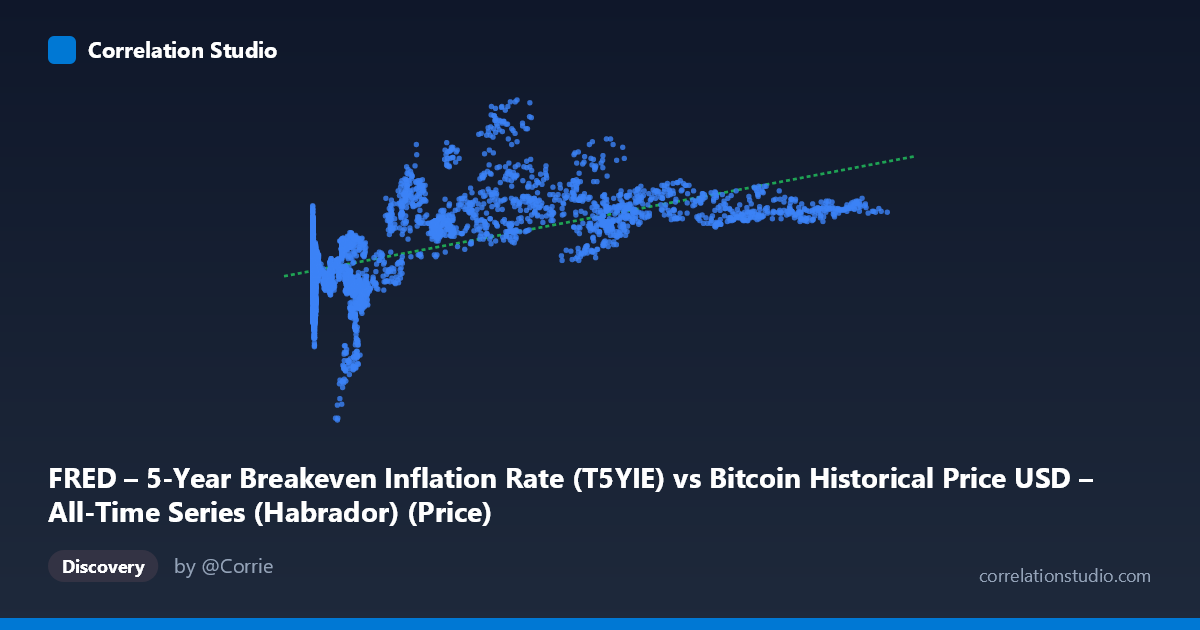
FRED – 5-Year Breakeven Inflation Rate (T5YIE) vs Bitcoin Historical Price USD – All-Time Series (Habrador) (Price)
- Pearson correlation (r)
- 0.6043
- Spearman correlation
- 0.5878
- p-value
- 0
- Sample size (n)
- 3946
- 95% confidence interval
- 0.5841 to 0.6238
- Granger causality
- None
- Granger optimal lag
- 1
AI analysis
Analysis: Bitcoin Price vs. 5-Year Breakeven Inflation Rate
Note on axis labeling: The metadata appears swapped — the values described (0.05 to 124,720) are clearly Bitcoin prices in USD, while the 0.14–3.59 range matches the 5-Year Breakeven Inflation Rate. The analysis below treats X = Bitcoin Price and Y = T5YIE, consistent with the actual data ranges and the regression equation provided.
1. What the Visualization Reveals
The scatterplot shows a moderate positive association between Bitcoin's price and 5-year inflation expectations. As Bitcoin has climbed from fractions of a cent through six-figure valuations, breakeven inflation rates have generally trended upward from roughly 1.3–1.7% toward 2.2–2.6%. However, the relationship is far from tight — at low Bitcoin prices (under $1,000), Y values scatter widely between 1.19 and 2.16, while at high prices ($50,000), Y values cluster more narrowly between 2.1 and 2.7, suggesting compression of variance at the high end rather than a clean linear trend throughout.
2. Strength, Direction, and Statistical Confidence
The correlation coefficient (r = 0.604) indicates a moderate positive relationship, with r² = 0.365 meaning only about 36.5% of the variance in inflation expectations is explained by Bitcoin's price level — leaving nearly two-thirds unexplained by this single variable. The 95% CI [0.584, 0.624] is tight and excludes zero, and the p-value (~0) confirms this correlation is statistically robust given the large sample (n=3,946) — but statistical significance here reflects sample size more than practical predictive power. Critically, Granger causality tests show no significant predictive direction in either direction (X→Y: p=0.657; Y→X: p=0.248). This is an important finding: despite the contemporaneous correlation, neither variable helps forecast the other's future values at a 1-period lag. This strongly suggests the relationship is not causal in either direction but rather reflects shared exposure to a common macro driver (e.g., both responding to monetary policy, real interest rates, or broad risk-on/risk-off sentiment over the 2010–2026 window).
3. Notable Patterns and Outliers
Several features stand out: (a) a dense cluster of low-price, low-to-moderate inflation points from Bitcoin's early years (2010–2013), (b) a "middle" regime (~$5,000–$20,000) where Y values are highly volatile (1.53–2.21) despite similar X values — indicating price alone doesn't pin down inflation expectations in this range, and (c) a compressed high-price cluster ($50,000) where inflation expectations settle into a narrower 2.1–2.7% band, possibly reflecting a specific post-2021 macro regime (elevated but anchored inflation expectations coinciding with Bitcoin's institutional adoption phase). The relationship also looks logarithmic rather than linear — most of the "action" in Y happens as X moves from near-zero to ~$10,000, with diminishing sensitivity afterward — suggesting a log-transform of X might fit better than the linear model shown.
4. Confounding Factors and Caveats
This is a classic case of spurious correlation risk via time-series trending: both series have exhibited long-term upward drift over 2010–2026 (Bitcoin due to adoption/scarcity dynamics, inflation expectations due to post-2020 monetary expansion and 2021–2023 inflation shocks). Two non-stationary trending series will show inflated correlation even absent any mechanistic link — the failed Granger test supports this interpretation. Additional confounders include: Federal Reserve policy shifts, COVID-era fiscal stimulus, real interest rate movements, and general risk-asset sentiment that could simultaneously drive both Bitcoin demand and inflation breakevens without one causing the other.
5. Recommendations for Further Investigation
- Detrend or difference both series (e.g., analyze % changes rather than levels) to test whether the correlation survives removing shared trend — this is the standard fix for spurious trending-series correlation. - Test additional lags in Granger causality (weekly/monthly rather than just 1-period) since Bitcoin and inflation expectations may interact on different time scales. - Introduce control variables like the Fed Funds rate, nominal 10-year Treasury yield, or DXY (dollar index) to see if the Bitcoin–T5YIE link disappears once common macro factors are controlled for (partial correlation analysis). - Segment by regime (pre-2020 vs. post-2020) since the relationship's strength and shape may differ meaningfully across Bitcoin's maturation as an asset class. - Treat this correlation as descriptive/associative only — it should not be used for trading or forecasting signals given the null Granger result and modest r².
X dataset: Bitcoin Historical Price USD – All-Time Series (Habrador)
Y dataset: FRED – 5-Year Breakeven Inflation Rate
Part of experiment: Bitcoin - Bitcoin Historical Price USD – All-Time Series (Habrador) vs FRED – 5-Year Breakeven Inflation Rate