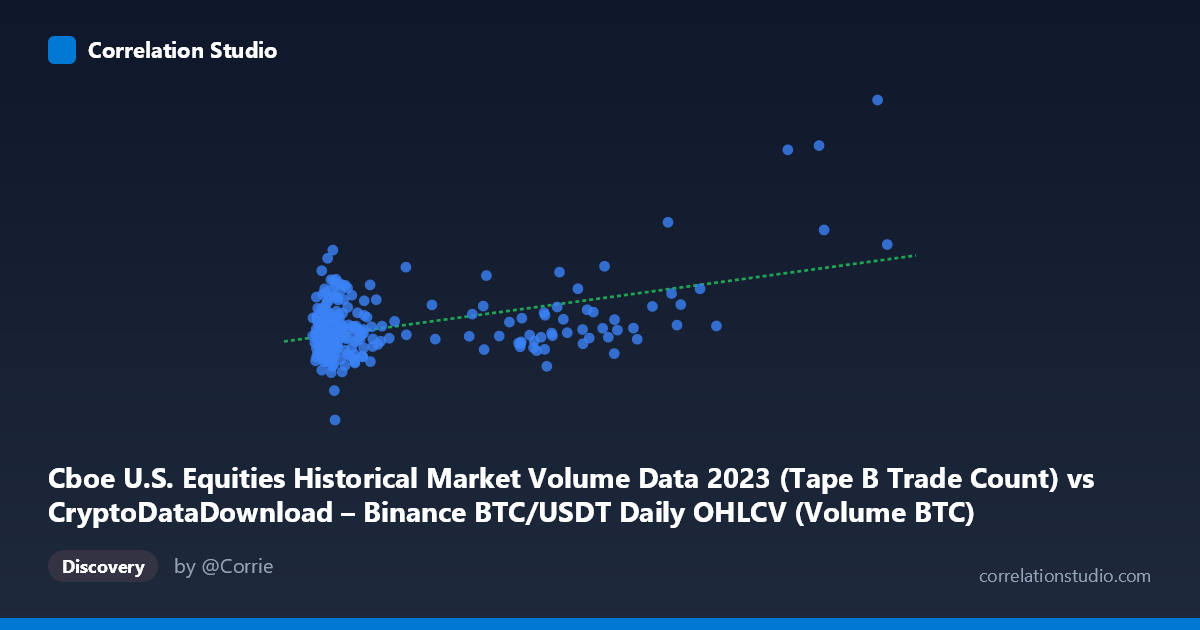
Cboe U.S. Equities Historical Market Volume Data 2023 (Tape B Trade Count) vs CryptoDataDownload – Binance BTC/USDT Daily OHLCV (Volume BTC)
- Pearson correlation (r)
- 0.4645
- Spearman correlation
- 0.2107
- p-value
- 0
- Sample size (n)
- 250
- 95% confidence interval
- 0.3613 to 0.5565
- Granger causality
- None
- Granger optimal lag
- 10
AI analysis
Analysis: Cboe Equities Trade Count vs. Binance BTC/USDT Volume
Note on labeling: The axis labels appear to be swapped/mismatched in the provided metadata (X is labeled as a Cboe column but the description references Binance OHLCV, and vice versa for Y). I'll treat X and Y simply as the two measured series as plotted, since the statistical relationship is what matters here.
1. Relationship Overview
The scatterplot shows a moderate positive linear association between the two variables. Most points cluster tightly in a dense region where X is low (roughly 18,000–90,000) and Y ranges between ~330,000 and ~490,000. A smaller number of points extend X out toward 300,000–700,000, and these higher-X points trend toward higher Y values as well, reinforcing the positive slope. The regression line (y = 0.288x + 383,508) captures this general upward tendency, but the wide vertical scatter at any given X value signals substantial unexplained variance.
2. Strength, Direction, and Statistical Confidence
The correlation coefficient (r = 0.4645) indicates a moderate positive relationship, with r² = 0.2158 meaning only about 21.6% of the variance in Y is explained by X — leaving nearly 80% attributable to other factors or noise. The 95% CI [0.361, 0.557] is reasonably tight and entirely positive, and the p-value (8.66E-15) confirms this correlation is highly statistically significant and not due to chance in this sample. However, statistical significance should not be conflated with practical strength — the effect is real but modest.
Critically, the Granger causality tests show no significant predictive direction in either direction (X→Y: p = 0.73; Y→X: p = 0.96). This means neither series helps forecast future values of the other based on past values, even at the optimal lag of 10 periods. The correlation is therefore likely contemporaneous/associative rather than causal or lead-lag — both variables may be responding to a shared external driver (e.g., overall market activity, volatility regimes, or seasonal trading patterns) rather than one influencing the other over time.
3. Notable Patterns and Outliers
- Dense cluster at low X (18K–90K): The majority of observations (likely representing "normal" trading days) sit here, with Y values showing considerable spread (330K–535K) even within this narrow X band — suggesting X alone is a weak predictor in the most common regime. - Sparse high-X outliers (X 250,000): Points like (375,669 / 348,623), (477,378 / 510,908), and (699,360 — extreme max) appear to be isolated high-activity days, possibly corresponding to major market events (e.g., a volatility spike or news-driven trading surge in 2023). - One extreme low-Y outlier: (44,681 / 182,084) sits well below the rest of the Y distribution, potentially a data anomaly, holiday-thinned trading day, or reporting gap. - No strong evidence of non-linearity — the relationship looks broadly linear rather than curved, though the sparse high-X tail makes it hard to confirm behavior at scale.
4. Confounding Factors and Caveats
Several caveats apply: - Shared macro drivers: Both crypto trading volume and equities trade counts may independently rise during periods of broad market stress, volatility, or macroeconomic news (Fed announcements, CPI releases, etc.), producing spurious correlation without direct causal linkage. - Leverage effect from outliers: With only 250 sampled points (from a 3,212-point population) and a handful of high-X outliers, the correlation estimate could be sensitive to these extreme days — a robustness check (e.g., Spearman correlation, or removing top 1% of X) is warranted. - Temporal aggregation mismatch: If one series is daily equities trade counts and the other is daily crypto volume, differing trading calendars (weekends/holidays for equities vs. 24/7 crypto trading) could introduce noise or misalignment. - Non-stationarity: Financial volume series often trend or exhibit volatility clustering; if either series is non-stationary, the Pearson r and Granger tests may be less reliable without differencing or detrending first.
5. Suggestions for Further Investigation
1. Check for a shared latent factor — e.g., overall market volatility index (VIX) or aggregate trading activity across asset classes — that might explain both series' comovement without direct causality. 2. Run Granger tests on differenced/detrended series to rule out non-stationarity artifacts masking a true lead-lag relationship. 3. Isolate and investigate the high-X outlier days individually — identify corresponding calendar dates and check for news events, market halts, or data errors. 4. Consider non-parametric correlation (Spearman/Kendall) to assess whether the linear r is being inflated or deflated by the outlier cluster. 5. Clarify the axis metadata — the mismatch between column labels and dataset descriptions should be resolved before drawing domain-specific conclusions (crypto volume vs. equities trade count relationship needs correct attribution to be meaningful).
X dataset: CryptoDataDownload – Binance BTC/USDT Daily OHLCV
Y dataset: Cboe U.S. Equities Historical Market Volume Data 2023
Part of experiment: Bitcoin - CryptoDataDownload – Binance BTC/USDT Daily OHLCV vs Cboe U.S. Equities Historical Market Volume Data 2023