Cboe U.S. Equities Historical Market Volume Data 2024 (Tape C Shares) vs Bitcoin Historical Price USD – All-Time Series (Habrador) (Price)
- Pearson correlation (r)
- 0.5142
- Spearman correlation
- 0.3856
- p-value
- 0
- Sample size (n)
- 252
- 95% confidence interval
- 0.4172 to 0.5997
- Granger causality
- None
- Granger optimal lag
- 10
AI analysis
Analysis: Cboe Equities Volume vs. Bitcoin Price (2024)
1. Relationship Overview
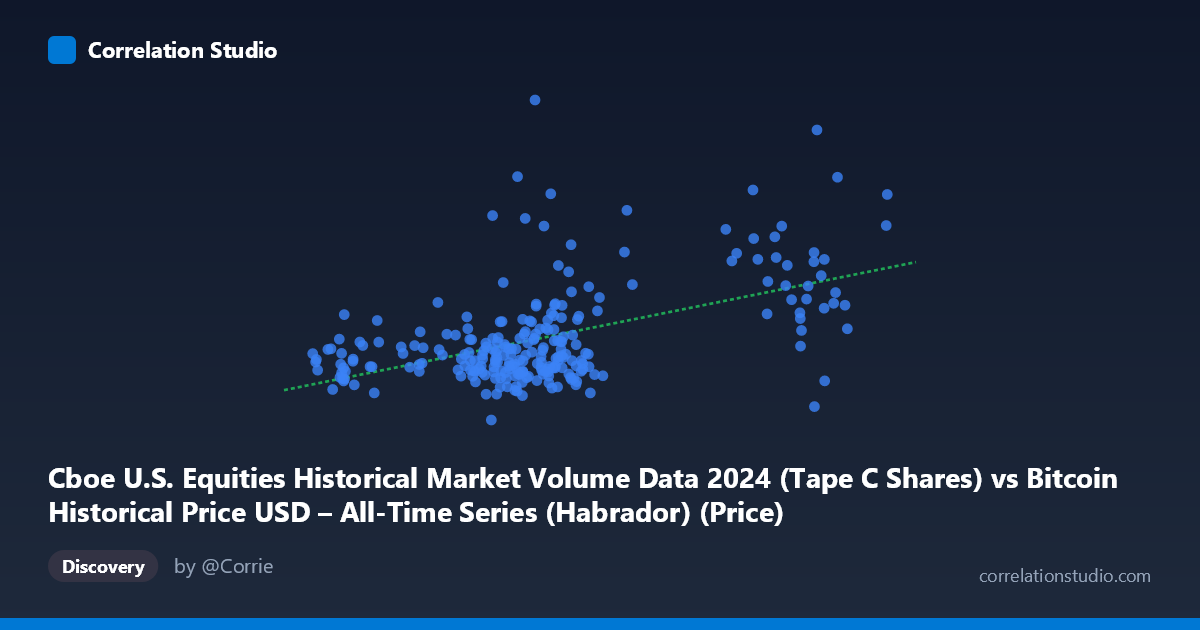
The scatterplot shows a moderate positive association between U.S. equities trading volume (Tape C shares, X-axis) and Bitcoin's daily USD price (Y-axis) across 252 paired daily observations in 2024. As equity volume increases, Bitcoin price tends to rise as well, but the relationship is loose and noisy rather than tight and deterministic — points are widely scattered around the fitted regression line (y = 2510.17x + 150,995,000), with substantial vertical spread at almost every x-value.
2. Strength, Direction, and Statistical Confidence
The correlation coefficient (r = 0.514) indicates a moderate positive linear relationship, but the r² of 0.264 reveals that only ~26% of the variance in Bitcoin price is explained by equity volume — leaving roughly 74% of price movement attributable to other factors entirely. The 95% CI [0.417, 0.600] is reasonably tight and excludes zero, and the p-value of ~0 confirms this correlation is statistically significant and not due to chance in this sample. However, statistical significance with a large n does not imply practical predictive power — r² of 0.26 is a weak-to-moderate effect size in practice.
Critically, the Granger causality tests show no significant predictive direction in either direction (X→Y: p=0.42; Y→X: p=0.39). This means that past equity volume does not help forecast future Bitcoin prices, nor does past Bitcoin price help forecast future equity volume, even at an optimal lag of 10 periods. This strongly suggests the contemporaneous correlation is not causal in a time-series/predictive sense — it may instead reflect both variables responding to shared macro conditions or coincidental co-movement over the year.
3. Patterns, Clusters, and Outliers
The data shows a dense cluster of points in the X range of ~56,000–72,000 with Y values mostly between 250M–400M, representing the bulk of "typical" trading days. A secondary, more sparse cluster appears at higher X values (96,000–101,000), corresponding to a handful of high-volume days later in the sample. Notable outliers include points like (64096, 488M) and (67052, 523M) — high Bitcoin prices without correspondingly extreme volume — and (60174, 199M), the lowest Y value in the dataset paired with a mid-range X. These outliers likely correspond to specific Bitcoin rally days (e.g., ETF approval news, halving-related sentiment) that were volume-independent events for equities.
4. Confounding Factors and Caveats
Several caveats limit causal interpretation: - Spurious correlation from shared trends: Both Bitcoin price and equity volume may have independently trended upward over 2024 due to broader risk-on sentiment, Fed policy, or macro liquidity conditions — producing correlation without any direct link. - Non-stationarity: Neither series is likely stationary (both may have secular trends across the year), which can inflate correlation estimates and invalidate simple Granger tests unless differenced. - Sampling mismatch: Tape C equity volume and BTC price operate in different markets with different drivers (equity market structure vs. crypto-specific catalysts like ETF flows, regulatory news, halving). - N vs. n discrepancy: The population is 4,786 but only 252 paired points were used — check whether this subsampling (e.g., every trading day vs. some other frequency) introduces selection bias.
5. Suggested Next Steps
- Test for spurious correlation: Run the correlation on detrended or differenced series (day-over-day % change) rather than levels, since both variables likely trend upward over the year. - Control for common macro factors: Introduce a third variable (e.g., VIX, DXY, Fed funds rate) to see if the BTC–volume relationship disappears after controlling for shared macro drivers. - Investigate the high-volume cluster: The ~96k–101k X cluster appears to be a distinct regime — check if this corresponds to a specific calendar period (e.g., quad-witching days, year-end rebalancing) that may be driving a nonlinear or regime-dependent relationship. - Given the null Granger result, do not use this equity volume series as a leading indicator for BTC price (or vice versa) in trading strategies — the relationship, while statistically present, carries no forecasting value at this lag structure.
X dataset: Bitcoin Historical Price USD – All-Time Series (Habrador)
Y dataset: Cboe U.S. Equities Historical Market Volume Data 2024
Part of experiment: Bitcoin - Bitcoin Historical Price USD – All-Time Series (Habrador) vs Cboe U.S. Equities Historical Market Volume Data 2024