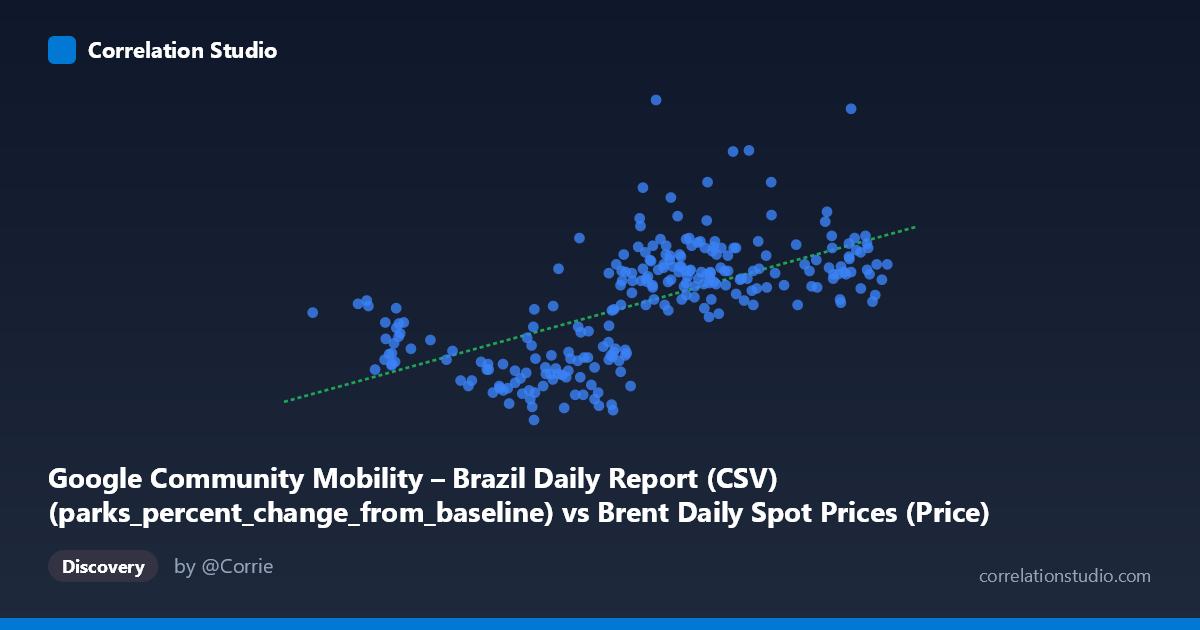
Google Community Mobility – Brazil Daily Report (CSV) (parks_percent_change_from_baseline) vs Brent Daily Spot Prices (Price)
- Pearson correlation (r)
- 0.6274
- Spearman correlation
- 0.6957
- p-value
- 0
- Sample size (n)
- 253
- 95% confidence interval
- 0.5463 to 0.6968
- Granger causality
- X → Y
- Granger optimal lag
- 1
AI analysis
Scatterplot Analysis: Brazil Parks Mobility vs. Brent Crude Oil Prices (2021)
Relationship Overview
The scatterplot reveals a moderate positive relationship between Google Community Mobility reports for parks in Brazil (X-axis, measured as percent change from baseline) and Brent crude oil spot prices (Y-axis, measured in USD per barrel). As park mobility increases — meaning more Brazilians are visiting parks relative to pre-pandemic baselines — Brent oil prices tend to be higher. The linear regression equation (y = 1.367x − 100.26) quantifies this: each one-percentage-point increase in park mobility is associated with approximately $1.37 more per barrel of Brent crude. The data spans the full calendar year 2021, a period marked by COVID-19 recovery dynamics, vaccine rollouts, and volatile energy markets — all of which provide important context for interpreting this relationship.
Correlation Strength, Direction, and Causality
With r = 0.627 and r² = 0.394, roughly 39.4% of the variance in Brent crude prices is explained by Brazilian park mobility, which is statistically meaningful but leaves ~60% of price variance unaccounted for. The 95% confidence interval of [0.546, 0.697] is reasonably tight and does not approach zero, and with p ≈ 0 across a paired sample of n = 253, the result is highly statistically significant — noise is an unlikely explanation. Critically, the Granger causality analysis indicates a unidirectional temporal relationship: X (park mobility) Granger-causes Y (Brent prices) at a one-period lag (F = 6.25, p = 0.013), while the reverse direction fails to meet conventional significance (F = 2.79, p = 0.096). This means that park mobility trends in Brazil carry statistically detectable predictive information about next-day Brent prices — though Granger causality reflects predictive precedence in the time series, not true economic causation, and should be interpreted cautiously.
Notable Patterns, Clusters, and Outliers
Several structural features are visible in the data. There appears to be a lower-left cluster — observations where park mobility is depressed (roughly 50–65% range) and oil prices are negative or deeply below baseline (Y values approaching −30 or lower). These likely correspond to earlier months of 2021 when COVID restrictions were stricter in Brazil and oil markets had not yet fully recovered. A denser central-to-upper-right cluster emerges around X = 70–85, Y = 0–25, consistent with mid-to-late 2021 as mobility rebounded and Brent climbed toward $80+/barrel. Some apparent outliers exist at the extremes — notably the point near (50.37, −6.67) representing very low mobility, and several high-mobility points with relatively muted oil price responses (e.g., ~84, 0–12 range), suggesting the relationship is not uniformly linear across the full range.
Confounding Factors and Interpretive Caveats
The most important caveat here is that this correlation is almost certainly driven by a shared third variable: global economic recovery from COVID-19. As pandemic conditions eased through 2021, both outdoor mobility in Brazil and global oil demand increased simultaneously — not because one caused the other, but because both responded to the same underlying macro driver. Seasonal effects compound this: Brazilian parks see naturally higher footfall in warmer months (Southern Hemisphere summer, roughly October–March), which partially overlaps with the energy demand cycle. Additionally, Brent crude is a globally traded commodity whose price is primarily driven by OPEC production decisions, U.S. inventory data, and geopolitical factors — not Brazilian park visits. The dataset note labeling these columns appears to have X and Y dataset descriptions swapped (park mobility labeled under Brent, and vice versa), which warrants verification before any downstream use. The N = 1,095 population versus n = 253 paired sample also means results are sensitive to how matching was performed across the two datasets.
Actionable Insights and Further Investigation
Despite the confounding concerns, several follow-up analyses are worth pursuing. First, partial correlation analysis controlling for a COVID severity index or vaccine rollout pace (e.g., weekly doses administered in Brazil) would help isolate whether any genuine mobility–energy signal persists. Second, since Granger causality at lag-1 is significant, a vector autoregression (VAR) model incorporating both series — along with global demand proxies like China PMI or U.S. jobless claims — could better quantify mobility's marginal predictive contribution. Third, decomposing by Brazilian season or state-level mobility might reveal heterogeneity obscured in the national aggregate. Finally, testing whether other mobility categories (transit, retail, workplaces) show stronger or weaker correlations with oil prices could clarify whether parks specifically carry a signal or whether this is simply a general mobility-recovery effect. The relationship is real and significant, but building a commodity price model on Brazilian park mobility alone would be premature without ruling out the pandemic-recovery confounder.
X dataset: Brent Daily Spot Prices
Y dataset: Google Community Mobility – Brazil Daily Report (CSV)
Part of experiment: Daily - Brent Daily Spot Prices vs Google Community Mobility – Brazil Daily Report (CSV)