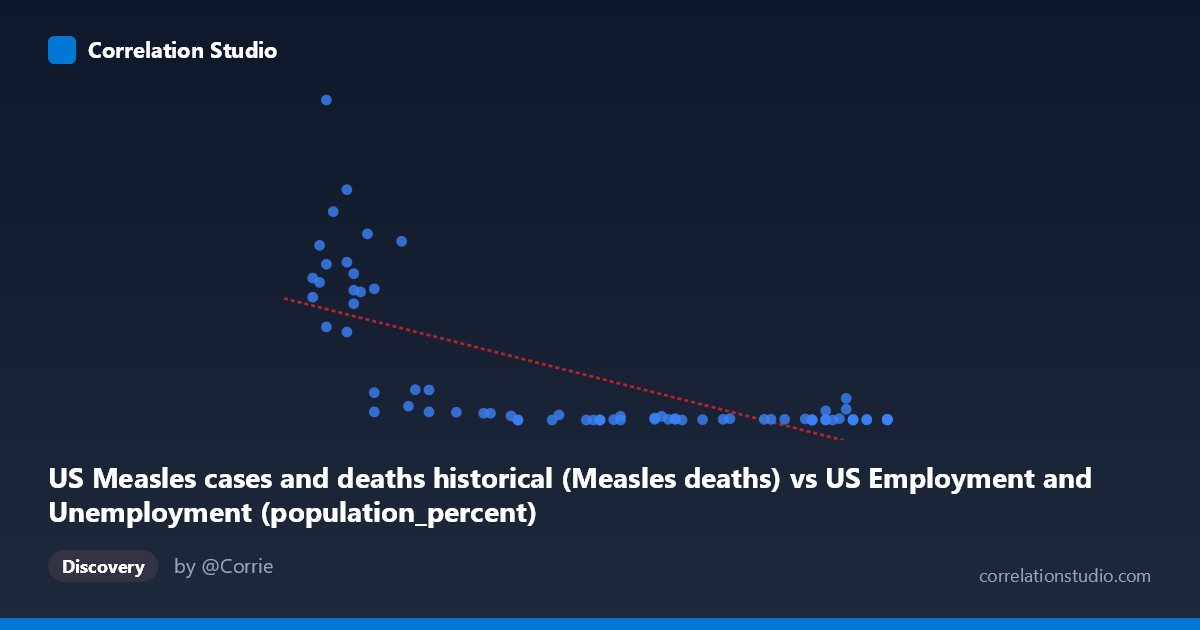
US Measles cases and deaths historical (Measles deaths) vs US Employment and Unemployment (population_percent)
- Pearson correlation (r)
- -0.7069
- Spearman correlation
- -0.6739
- p-value
- 0
- Sample size (n)
- 74
- 95% confidence interval
- -0.8053 to -0.5706
- Granger causality
- None
- Granger optimal lag
- 10
AI analysis
Scatterplot Analysis: Measles Deaths vs. Employment Population Percent
Overall Relationship
The scatterplot reveals a strong negative association between US measles deaths (X-axis) and the employment population percentage (Y-axis), spanning data from 1949 to 2022. As measles deaths increase, the employment population percentage tends to decrease markedly. The linear regression equation (y = -51.48x + 3361.24) captures this downward trajectory, though the data are clearly not uniformly distributed — they cluster into two visually distinct regions: a dense low-death, low-employment-percent cluster and a dispersed high-death, higher-employment-percent region. This bifurcated structure immediately hints that both variables are being driven by a common temporal force rather than any direct causal mechanism.
Correlation Strength and Statistical Significance
The Pearson correlation of r = -0.707 is statistically robust, with a p-value of 1.94×10⁻¹², making it highly unlikely to be a chance finding given n = 74 paired observations. The 95% confidence interval of [-0.81, -0.57] is reasonably tight and does not cross zero, confirming the negative direction with strong confidence. However, R² = 0.50 means that only about half of the variance in employment population percentage is explained by measles deaths — a meaningful but far from complete explanatory relationship. The remaining ~50% of variance is driven by other factors entirely. Critically, Granger causality analysis finds no significant predictive direction in either direction (X→Y: F = 0.82, p = 0.62; Y→X: F = 0.87, p = 0.57), meaning measles deaths do not temporally predict employment rates, nor vice versa. This is a pivotal finding: the correlation, however strong statistically, carries no temporal predictive signal.
Notable Patterns, Clusters, and Outliers
The data exhibit a pronounced bimodal clustering pattern. The majority of points pile up near zero measles deaths with employment percentages also near zero or low, reflecting the post-vaccination era (post-1963) when measles was largely eliminated. A second, more dispersed cluster occupies the upper-left region — higher measles deaths paired with higher employment percentages — corresponding to the pre-vaccine era. Several notable outliers stand out: the point at (58.90, 949.00) is a dramatic high-leverage outlier with an exceptionally high employment-population percentage, and similarly (59.20, 683.00) and (59.00, 618.00) represent extreme Y values. These outliers, concentrated in the low-X / high-Y region, likely exert disproportionate influence on the regression slope. The near-zero Y-values spread across a wide X range further suggest a non-linear or threshold relationship rather than a clean linear one.
Confounding Factors and Interpretation Caveats
This correlation is almost certainly a classic spurious correlation driven by time. Both variables changed dramatically over the same historical period: measles deaths declined sharply following vaccine introduction in the 1960s, while employment population percentage evolved due to entirely independent demographic and economic forces (women's labor force entry, Baby Boomer workforce participation, Great Society-era economic expansion, and subsequent structural shifts). The shared temporal trend — not any biological or economic mechanism — is likely generating the correlation. Additionally, the axis labels appear counterintuitive (measles deaths labeled under an employment dataset and vice versa), suggesting possible dataset column misalignment that warrants verification before drawing any conclusions. The unequal variance across the X range (heteroscedasticity) also violates linear regression assumptions, making the R² estimate somewhat unreliable.
Actionable Insights and Further Investigation
Given the absence of Granger causality and the likely time-confounded nature of this relationship, no direct causal or policy inference should be drawn between measles mortality and employment rates. Recommended next steps include: (1) detrending both series by differencing or residualizing against year to isolate any relationship independent of shared temporal drift; (2) verifying dataset column assignments, as the axis source labels appear swapped; (3) testing for structural breakpoints around 1963 (vaccine introduction) to model the two eras separately; and (4) exploring multivariate models that include year, GDP, and demographic covariates to properly attribute variance. This correlation serves as a useful pedagogical example of how two time-series variables can yield impressive statistical associations while being causally unrelated.
X dataset: US Employment and Unemployment
Y dataset: US Measles cases and deaths historical
Part of experiment: Yearly - US Employment and Unemployment vs US Measles cases and deaths historical