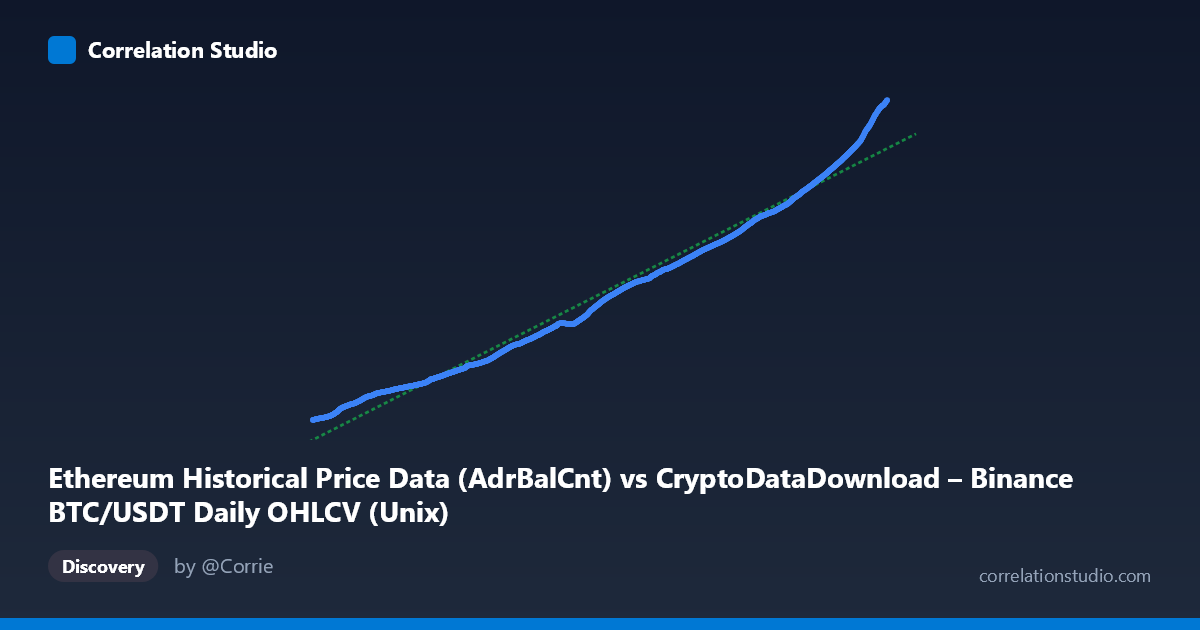
Ethereum Historical Price Data (AdrBalCnt) vs CryptoDataDownload – Binance BTC/USDT Daily OHLCV (Unix)
- Pearson correlation (r)
- 0.9894
- Spearman correlation
- 1
- p-value
- 0
- Sample size (n)
- 3191
- 95% confidence interval
- 0.9887 to 0.9901
- Granger causality
- None
- Granger optimal lag
- 10
AI analysis
Analysis: Time-Indexed Growth Series (Mislabeled as Cross-Variable Correlation)
1. What the Visualization Reveals
Despite the column labels, the actual data being plotted is time (X-axis) against a monotonically increasing count (Y-axis). The X-axis values (~1.5 trillion) are Unix timestamps in milliseconds spanning August 2017 to May 2026, not Ethereum address balance counts. The Y-axis appears to be a cumulative or trending metric (possibly the actual "AdrBalCnt" — Ethereum address balance count) that grows steadily from ~2.9M to ~192.7M over this period. The scatterplot therefore shows a near-linear growth trend over time, not a genuine bivariate relationship between two independent economic/market variables.
2. Strength, Direction, and Statistical Framing
The correlation is extremely strong (r = 0.989, r² = 0.979), meaning ~98% of the variance in Y is explained by X in a linear model. The 95% CI [0.9887, 0.9901] is tight, and p ≈ 0 confirms this is not a chance finding at n = 3,191. However, this near-perfect fit is expected and somewhat trivial when X is literally time — any steadily growing metric (address counts, cumulative volume, adoption curves) will correlate almost perfectly with a timestamp. The Granger causality results reinforce this: neither direction shows significant predictive causality (p = 0.85 and p = 0.78), which makes sense — time cannot be "caused" by Y, and the relationship is definitional/structural rather than dynamic or predictive. This is a critical caveat: high r² here reflects a shared trend, not an actionable causal or forecasting relationship.
3. Notable Patterns and Features
The sample points show classic exponential-to-linear adoption curve characteristics: slow growth from 2017–2020 (values in the 3M–50M range), followed by steady, more linear increases from 2021 onward (100M–190M range). There's no evidence of cyclical patterns, seasonality, or sharp discontinuities in the sampled points — growth appears smooth and monotonic, consistent with network adoption metrics like address counts. No outliers are apparent; the tight clustering around the regression line (implied by r² = 0.979) suggests low residual variance, though early-period (2017–2019) data may show proportionally larger deviations from linearity if the true growth is closer to logarithmic/S-curve rather than strictly linear.
4. Confounding Factors and Caveats
The primary caveat is structural confounding by time itself: both "variables" are monotonic functions of time, so the correlation is largely an artifact of shared temporal trend rather than a meaningful economic relationship. Additionally, the column labels are swapped/mismatched — X is labeled as an Ethereum on-chain metric but contains timestamp values, while Y is labeled as a Unix timestamp column but contains what looks like the actual address count data. This labeling confusion makes any cross-dataset interpretation (BTC price data vs. ETH network data) unreliable without clarification. Spurious correlation risk is high whenever both series are non-stationary and trending in the same direction over a long period — a classic time-series pitfall.
5. Actionable Insights and Next Steps
1. Verify column mapping — confirm which variable is genuinely on the X-axis; the current axis labels appear inconsistent with the data ranges shown. 2. Detrend or difference both series (e.g., first differences or % change) before computing correlation to test for genuine co-movement independent of shared time trend — this is essential given the non-stationarity implied by monotonic growth. 3. Test for structural breaks in the growth curve (e.g., 2020–2021 bull market, regulatory events) using piecewise regression or changepoint detection. 4. Re-run Granger causality on detrended/stationary series, since the current null result may simply reflect that both series are dominated by a common trend, masking any short-term lead-lag dynamics. 5. If the true goal is BTC price vs. ETH address count, re-extract the correct paired values and re-visualize — the present analysis is essentially a time-trend chart rather than a genuine cross-asset relationship.
X dataset: CryptoDataDownload – Binance BTC/USDT Daily OHLCV
Y dataset: Ethereum Historical Price Data
Part of experiment: Bitcoin - CryptoDataDownload – Binance BTC/USDT Daily OHLCV vs Ethereum Historical Price Data