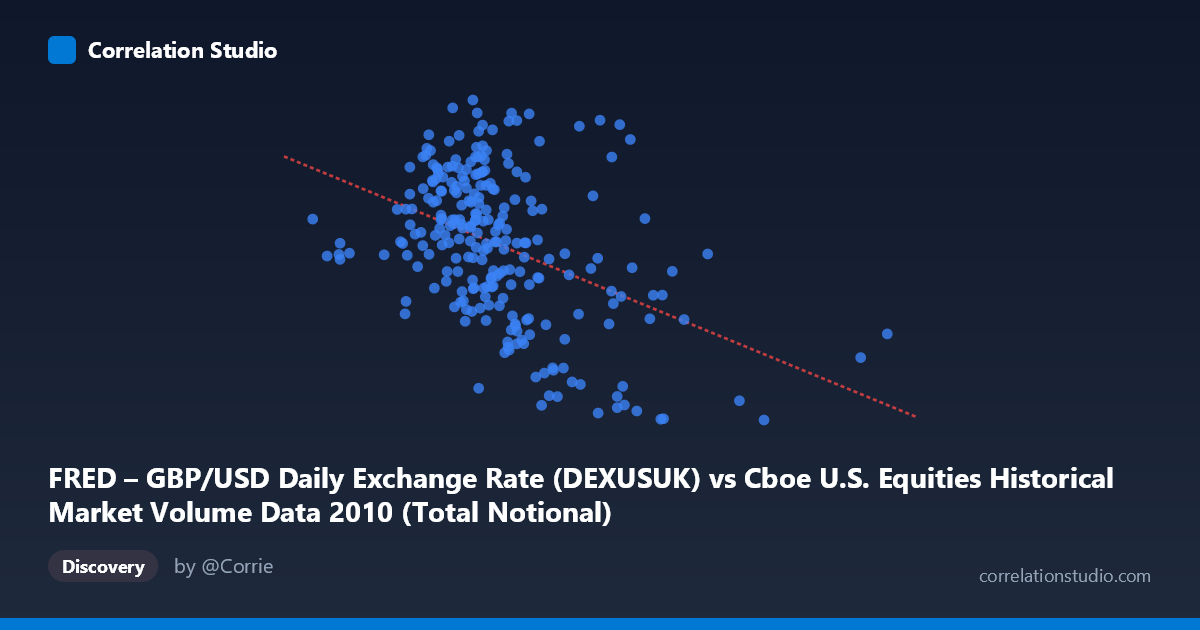
FRED – GBP/USD Daily Exchange Rate (DEXUSUK) vs Cboe U.S. Equities Historical Market Volume Data 2010 (Total Notional)
- Pearson correlation (r)
- -0.4308
- Spearman correlation
- -0.4089
- p-value
- 0
- Sample size (n)
- 249
- 95% confidence interval
- -0.5269 to -0.3238
- Granger causality
- None
- Granger optimal lag
- 1
AI analysis
Analysis: GBP/USD Exchange Rate vs. U.S. Equities Total Notional Volume (2010)
Relationship Overview The scatterplot reveals a modest negative relationship between U.S. equities total notional trading volume (X-axis) and the GBP/USD exchange rate (Y-axis) across 249 trading days in 2010. As notional volume increases, the pound tends to weaken slightly against the dollar — visually manifested as a downward-sloping cloud of points. The linear regression equation (y = -3.89×10⁻¹²x + 1.616) confirms this negative slope, though the scatter around the regression line is considerable, indicating that volume alone is a weak predictor of the exchange rate on any given day.
Correlation Strength and Statistical Significance The Pearson correlation of r = -0.43 represents a weak-to-moderate negative association. Critically, the r² = 0.186 tells the more sobering story: notional volume explains only ~18.6% of the variance in GBP/USD, leaving over 80% attributable to other factors. The 95% confidence interval of [-0.527, -0.324] is entirely negative, and the p-value of 1.13×10⁻¹² confirms the relationship is statistically distinguishable from zero at virtually any conventional threshold — though with N = 3,302 underlying observations, statistical significance here reflects sample power more than practical magnitude. Most importantly, Granger causality tests find no significant directional predictive relationship in either direction (X→Y: p = 0.456; Y→X: p = 0.084), meaning past notional volume does not reliably forecast future exchange rates, and vice versa — the correlation appears contemporaneous rather than causal.
Patterns, Clusters, and Outliers The bulk of observations cluster between roughly 10–25 billion in notional volume and 1.50–1.62 GBP/USD, forming a dense central mass. Several notable outliers emerge at the high-volume extreme — points exceeding 28–44 billion notional that correspond to lower exchange rate values (around 1.43–1.51), pulling the regression slope downward and likely exerting disproportionate influence on the correlation coefficient. There is also a visible cluster of high-GBP/USD readings (1.60–1.64) concentrated at relatively lower notional volumes, consistent with the negative trend. The Y-axis range is strikingly compressed (1.43–1.64, a span of only ~21 pips), which means even small measurement noise or rounding effects could meaningfully distort apparent patterns.
Confounding Factors and Interpretive Caveats Several confounds complicate a causal interpretation. First, both variables are simultaneously influenced by macro-financial conditions: risk-off episodes in 2010 (e.g., European sovereign debt crisis flare-ups) could simultaneously spike U.S. equity trading volume and depress GBP/USD, creating spurious co-movement. Second, high-volume days often coincide with broad market stress or index rebalancing, which independently affects currency markets through capital flow dynamics rather than any direct mechanism. Third, the compressed Y-axis range means the exchange rate variation captured here is economically narrow — the entire year's GBP/USD movement fits within ~15 basis points of a 1.5x rate, which may not be economically meaningful. Finally, the lag-1 Granger test used may be too short to capture delayed macro transmission effects.
Actionable Insights and Further Investigation Despite the limited explanatory power, several follow-up analyses are warranted. Regime segmentation — splitting the data into high-stress vs. calm market periods using a VIX threshold — would test whether the correlation is driven entirely by a handful of crisis-day outliers. Extending the Granger causality test to longer lags (5–10 days) could reveal slower transmission mechanisms missed at lag 1. Researchers should also control for concurrent S&P 500 returns and VIX levels via multivariate regression to isolate whether the volume-FX link survives or disappears — a common-cause confound seems the most probable explanation for the observed correlation. Finally, replicating this analysis across multiple years would reveal whether the 2010 relationship is structurally persistent or an artifact of that year's specific macro environment, including Brexit-precursor political dynamics and post-GFC volatility patterns.
X dataset: Cboe U.S. Equities Historical Market Volume Data 2010
Y dataset: FRED – GBP/USD Daily Exchange Rate
Part of experiment: Daily - Cboe U.S. Equities Historical Market Volume Data 2010 vs FRED – GBP/USD Daily Exchange Rate