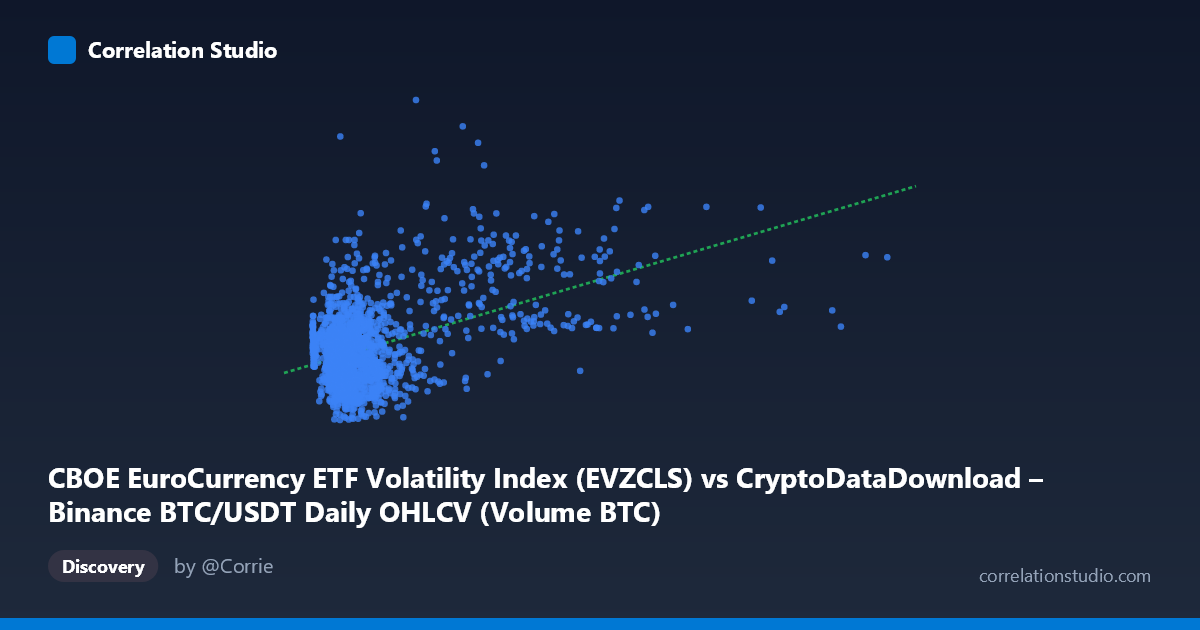
CBOE EuroCurrency ETF Volatility Index (EVZCLS) vs CryptoDataDownload – Binance BTC/USDT Daily OHLCV (Volume BTC)
- Pearson correlation (r)
- 0.4798
- Spearman correlation
- 0.1895
- p-value
- 0
- Sample size (n)
- 1903
- 95% confidence interval
- 0.4445 to 0.5137
- Granger causality
- None
- Granger optimal lag
- 1
AI analysis
Analysis: EVZCLS vs. BTC/USDT Volume
1. Relationship Overview
The scatterplot shows a positive, moderate-strength relationship between the CBOE EuroCurrency ETF Volatility Index (EVZCLS, x-axis) and Binance BTC/USDT trading volume (y-axis). The data forms a dense cluster at low-to-moderate x-values (roughly 500–150,000) with y-values concentrated between 5–9, and a long, sparse tail extending toward higher x-values (up to ~760,000) where y-values become more scattered and occasionally spike higher (e.g., the point near x=303,000, y=11.39). This pattern—a compact core with a thinning, higher-variance tail—is typical of financial/volume data with heavy right-skew in one variable.
2. Strength, Direction, and Statistical Confidence
The correlation coefficient (r = 0.48) indicates a moderate positive relationship, with r² = 0.23 meaning only about 23% of the variance in BTC trading volume is explained by EVZ levels—leaving roughly 77% attributable to other factors. The 95% CI [0.44, 0.51] is fairly tight given the large sample (n=1,903), and the p-value ≈ 0 confirms this correlation is highly unlikely to be due to chance. However, statistical significance here reflects sample size more than practical strength—r=0.48 is a real but modest association, not a tight predictive relationship.
Critically, the Granger causality tests show no significant predictive direction in either direction (X→Y: p=0.28; Y→X: p=0.54). This means that past values of EVZ do not help forecast future BTC volume, and vice versa, at the tested lag (1 period). This is an important caveat: despite the contemporaneous correlation, there's no evidence of a lead-lag temporal relationship—the co-movement may be driven by shared exposure to broader market conditions rather than one variable causing or forecasting the other.
3. Notable Patterns and Outliers
The data shows a clear heteroscedastic funnel shape: variance in y increases as x increases, especially beyond x≈150,000. Notable outliers include the point at (303,019.81, 11.39)—likely coinciding with a EUR volatility spike (possibly a Euro-area macro event) alongside unusually high BTC volume. Most data, however, clusters tightly at low EVZ values (under 100,000) with y between 5–8, suggesting that "normal" EVZ regimes correspond to a fairly stable, moderate BTC volume range. The sparse, high-leverage points at the tail could disproportionately influence the linear regression slope (1.06E-5) and the r² estimate.
4. Confounding Factors and Caveats
Several caveats apply: - Mismatched economic domains: EVZ tracks EUR/USD FX volatility expectations, while the y-axis is crypto trading volume—any correlation is likely driven by a common macro factor (e.g., general market risk-off sentiment, USD strength, or global liquidity conditions) rather than a direct causal link. - Non-stationarity: Both series may trend over multi-year periods (2017–2025), inflating correlation via shared time trends rather than genuine covariation. - Heteroscedasticity violates linear regression assumptions, meaning the reported R²/slope may not represent the relationship uniformly across the x-range. - Outlier sensitivity: A handful of extreme x-values could be disproportionately driving the correlation estimate.
5. Recommendations for Further Investigation
To clarify this relationship: (1) detrend or difference both series to test correlation on stationary data, removing spurious trend-driven correlation; (2) test additional lags (2–5 days/periods) for Granger causality, since the 1-period test may miss delayed effects; (3) segment the analysis by EVZ regime (low/medium/high volatility) to check if the relationship strengthens during market stress periods; and (4) introduce a third variable (e.g., VIX, DXY, or crypto-specific volatility indices) to test whether EVZ's correlation with BTC volume is mediated by broader risk sentiment rather than being a direct bilateral relationship.
X dataset: CryptoDataDownload – Binance BTC/USDT Daily OHLCV
Y dataset: CBOE EuroCurrency ETF Volatility Index
Part of experiment: Bitcoin - CryptoDataDownload – Binance BTC/USDT Daily OHLCV vs CBOE EuroCurrency ETF Volatility Index