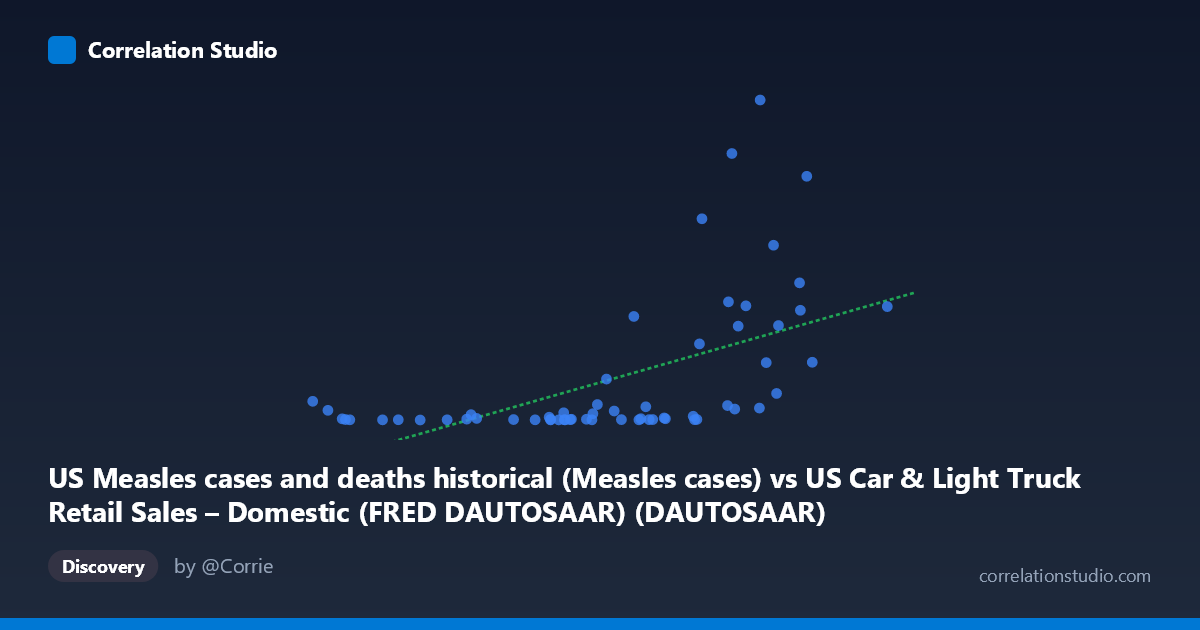
US Measles cases and deaths historical (Measles cases) vs US Car & Light Truck Retail Sales – Domestic (FRED DAUTOSAAR) (DAUTOSAAR)
- Pearson correlation (r)
- 0.5464
- Spearman correlation
- 0.68
- p-value
- 0.000006
- Sample size (n)
- 60
- 95% confidence interval
- 0.3396 to 0.7028
- Granger causality
- None
- Granger optimal lag
- 10
- Time coverage
- 1967-01-01 to 2026-01-01
- Recomputed on refreshed data
- 2026-10-20 (r was 0.5463)
AI analysis
Scatterplot Analysis: US Measles Cases vs. Domestic Auto Sales
1. Overall Relationship Revealed
The scatterplot displays a positive association between US measles cases (X-axis) and domestic car and light truck retail sales (Y-axis) across a dataset spanning 1967–2025. At first glance, the relationship appears loosely upward-trending, but the distribution is notably heteroscedastic — variance in auto sales expands dramatically at higher measles case counts. The scatter is wide and irregular, with many low-Y values clustered at moderate X values, and a handful of extreme high-Y values pulling the regression line upward. This visual messiness immediately signals that any apparent relationship warrants extreme skepticism before interpretation.
2. Correlation Strength, Direction, and Temporal Causality
The Pearson r of 0.558 indicates a moderate positive correlation, but the r² of 0.311 means that only 31.1% of the variance in auto sales is statistically "explained" by measles case counts — leaving nearly 70% unexplained by this model alone. The 95% confidence interval for r spans [0.352, 0.712], confirming the correlation is reliably non-zero, and the p-value of 4.4×10⁻⁶ confirms high statistical significance given N=105. However, statistical significance here is almost certainly a product of shared temporal trends rather than any meaningful causal link. Critically, Granger causality testing finds no significant predictive direction in either direction — measles cases do not temporally predict auto sales (F=2.08, p=0.062), and auto sales do not predict measles cases (F=1.28, p=0.287). Even the marginal X→Y result falls short of conventional significance. The fact that Spearman ρ exceeds Pearson r further confirms a non-linear underlying structure, suggesting a logarithmic or polynomial fit would better describe the data geometry.
3. Notable Patterns, Clusters, and Outliers
Several structural features stand out: - A dense low-Y cluster exists across X values of roughly 3–7 (moderate measles cases), where auto sales values remain below ~5,000 units. These likely represent post-vaccine-era years (post-1970s) where measles was largely eliminated. - High-leverage outliers at coordinates like (8.26, 75,290), (7.84, 62,705), and (7.39, 47,351) exert disproportionate influence on the regression line and r value. - Low-X, high-Y anomalies such as (1.86, 2,288) and (2.07, 285) break any simple monotonic story. - The regression line y = 4,824.6x − 19,885 is heavily distorted by these outliers, and a log-transformed Y axis would likely reveal a far more coherent (or coherently absent) pattern.
4. Confounding Factors and Critical Caveats
This correlation is almost certainly a classic spurious correlation driven by shared temporal trends. Both variables track through overlapping historical periods (1967–2025): measles cases were high in the pre-vaccine era (pre-1968 MMR vaccine), declined sharply through the 1970s–80s, and have had minor resurgences; meanwhile, domestic auto sales follow entirely independent macroeconomic cycles (oil shocks, recessions, COVID-19 disruption). The apparent correlation likely reflects confounding by calendar time — both series changed dramatically over the same decades for completely unrelated reasons. Additionally, the wide standard deviations (Y stdev = 17,194 against a mean of 9,881) and extreme range compression make this correlation arithmetically fragile. Dataset alignment (annual measles figures matched to monthly SAAR auto data) may also introduce temporal resolution mismatches.
5. Actionable Insights and Further Investigation
Given the absence of Granger causality and the near-certain spurious nature of this correlation, no policy or practical inference should be drawn from this relationship as stated. However, productive next steps include:
- Detrending both series (e.g., first-differencing or HP filtering) to remove shared secular trends before recalculating correlation — this would likely collapse r toward zero. - Log-transforming Y (auto sales span four orders of magnitude) and refitting with a polynomial or logarithmic regression, as suggested by the Spearman vs. Pearson discrepancy. - Segmenting by era (pre-1970, 1970–2000, 2000–present) to test whether correlation persists within periods of stable measles incidence. - Using this as a pedagogical example of spurious correlation for data literacy training — it illustrates precisely why r and p-values alone cannot establish meaningful relationships without causal theory and temporal independence testing.
X dataset: US Car & Light Truck Retail Sales – Domestic (FRED DAUTOSAAR)
Y dataset: US Measles cases and deaths historical
Part of experiment: Yearly - US Car & Light Truck Retail Sales – Domestic (FRED DAUTOSAAR) vs US Measles cases and deaths historical