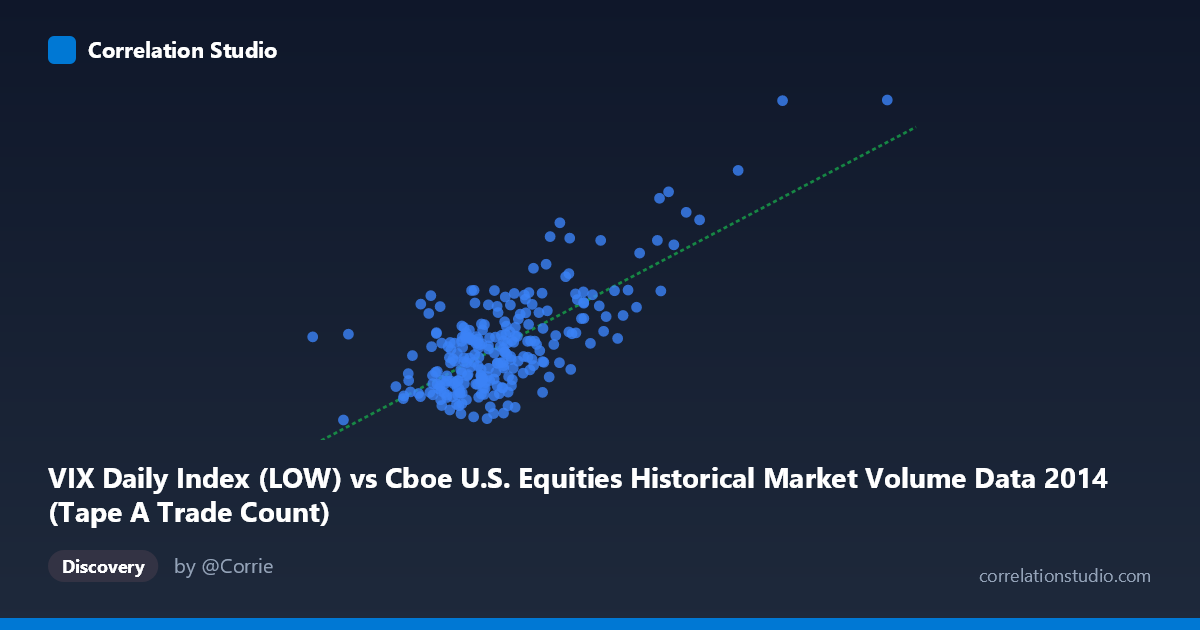
VIX Daily Index (LOW) vs Cboe U.S. Equities Historical Market Volume Data 2014 (Tape A Trade Count)
- Pearson correlation (r)
- 0.7242
- Spearman correlation
- 0.5504
- p-value
- 0
- Sample size (n)
- 252
- 95% confidence interval
- 0.6597 to 0.7781
- Granger causality
- None
- Granger optimal lag
- 1
AI analysis
Analysis: VIX Low vs. Tape A Trade Count (2014)
Relationship Overview The scatterplot reveals a positive relationship between the VIX Daily Index Low values and Tape A Trade Count across U.S. equity exchanges in 2014. As the VIX low increases — indicating elevated baseline fear or uncertainty in the market — the number of Tape A trades tends to rise correspondingly. This is intuitively consistent with market microstructure theory: periods of heightened volatility typically drive increased trading activity as participants react to price movements, rebalance portfolios, and execute hedging strategies. The linear regression equation (y = 6.76e⁻⁶x + 5.589) confirms a modest but meaningful positive slope across the observed range.
Correlation Strength and Statistical Significance The Pearson correlation of r = 0.724 indicates a moderately strong positive association, and the r² of 0.5245 means that approximately 52.4% of the variance in Tape A Trade Count is explained by VIX Low values — a substantial proportion for financial market data, though nearly half the variance remains attributable to other factors. The 95% confidence interval of [0.660, 0.778] is relatively tight and does not approach zero, reinforcing the reliability of this estimate. The p-value of effectively 0 across n = 252 paired samples (drawn from a population of N = 3,686) confirms this relationship is highly statistically significant and unlikely to be a chance artifact. However, Granger causality testing tells a more nuanced story: neither direction shows significant temporal predictive power at the optimal lag of 1 period. The X→Y result (F = 3.76, p = 0.054) just misses the conventional 0.05 threshold, while Y→X (F = 0.35, p = 0.555) shows no predictive signal whatsoever. This means that while the two variables are strongly correlated contemporaneously, VIX Low does not reliably lead or predict next-period trade counts in a temporal sense.
Patterns, Clusters, and Outliers The sample points reveal several notable structural features. The bulk of observations cluster in the VIX Low range of roughly 900,000–1,400,000 with Y values between approximately 10.5 and 16, forming a dense core that anchors the regression line. However, there are clear high-leverage outliers in the upper-right region — most notably the point near (2,171,498; 24.61) and another near (1,834,381; 19.60) — which likely correspond to discrete volatility spike events in 2014, such as the October market selloff driven by Ebola fears and geopolitical tensions. The point at (527,319; 14.01) stands as a notable low-X outlier, suggesting unusually low market volume on a day with moderate VIX, possibly a holiday-adjacent or low-liquidity session. These extreme observations likely exert disproportionate influence on the regression slope and correlation coefficient, and the relationship may appear less pronounced if they were excluded.
Confounding Factors and Caveats Several important caveats temper interpretation. First, the axis labels appear reversed in the dataset metadata — the X-axis is labeled as VIX Low from the "Cboe Market Volume" dataset, while the Y-axis draws Tape A Trade Count from the "VIX Daily Index" dataset, suggesting a possible data joining irregularity worth verifying. Second, common drivers such as macroeconomic announcements (FOMC meetings, NFP releases), earnings seasons, and end-of-quarter rebalancing could simultaneously elevate both VIX and trade volumes, creating spurious or inflated correlation that doesn't reflect a direct causal mechanism. Third, the failure of Granger causality in either direction suggests these variables may be jointly driven by an unobserved common factor (e.g., realized market stress) rather than one causing the other. Finally, the 2014 sample period captures specific market regimes and may not generalize to other years with different volatility structures.
Actionable Insights and Further Investigation Practitioners monitoring equity market liquidity should note that VIX levels serve as a useful contemporaneous proxy for trade activity intensity, even if not a lead indicator. For further investigation, it would be valuable to: (1) partial out calendar effects (day of week, month-end, major announcement days) to isolate the pure VIX-volume relationship; (2) test whether the relationship is nonlinear — a log-log or polynomial regression may better capture the apparent acceleration in trade counts at high VIX levels suggested by the outlier cluster; (3) extend the analysis across multiple years to assess whether the r = 0.72 relationship is stable or regime-dependent; and (4) introduce realized volatility or intraday range as an alternative regressor to determine whether VIX Low specifically, versus broader volatility measures, is the most informative predictor of trading volume.
X dataset: Cboe U.S. Equities Historical Market Volume Data 2014
Y dataset: VIX Daily Index
Part of experiment: Daily - Cboe U.S. Equities Historical Market Volume Data 2014 vs VIX Daily Index