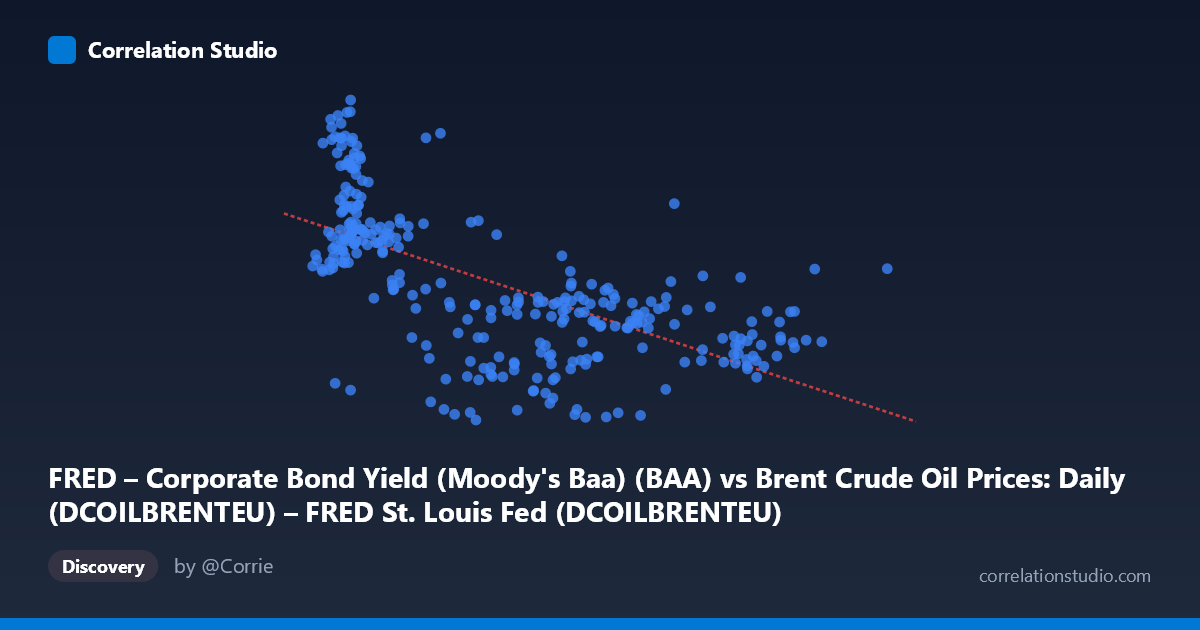
FRED – Corporate Bond Yield (Moody's Baa) (BAA) vs Brent Crude Oil Prices: Daily (DCOILBRENTEU) – FRED St. Louis Fed (DCOILBRENTEU)
- Pearson correlation (r)
- -0.6427
- Spearman correlation
- -0.6834
- p-value
- 0
- Sample size (n)
- 296
- 95% confidence interval
- -0.7051 to -0.5705
- Granger causality
- None
- Granger optimal lag
- 1
AI analysis
Analysis: Brent Crude Oil Price vs. Moody's Baa Corporate Bond Yield
Relationship Overview
The scatterplot reveals a moderate negative relationship between Brent crude oil prices (X-axis, USD/barrel) and Moody's Baa corporate bond yields (Y-axis, percent). As oil prices rise, bond yields tend to fall, and the linear regression equation ŷ = −0.0382x + 8.747 captures this downward slope. Visually, the data show a clear left-side cluster of high yields (8–11%) paired with low oil prices (roughly $10–$40/barrel), and a right-side cluster of lower yields (4–7%) paired with higher oil prices ($60–$140/barrel). This pattern is broadly consistent with the multi-decade time span covered (1987–2026), during which oil prices rose dramatically while bond yields trended structurally downward.
Correlation Strength and Statistical Significance
The Pearson correlation of r = −0.643 indicates a moderate-to-strong negative association, and the R² of 0.413 means that approximately 41% of the variance in Baa bond yields is explained by oil prices — a meaningful but incomplete picture, leaving 59% of variance attributable to other factors. The 95% confidence interval of [−0.705, −0.571] is relatively tight and entirely negative, reinforcing that the direction of the relationship is robust. The p-value of ~0 (across N = 1,288 observations) confirms this is not a chance finding. However, Granger causality results tell an important cautionary tale: neither direction (X→Y nor Y→X) reaches statistical significance at lag 1 (F = 0.49, p = 0.48 and F = 0.004, p = 0.95, respectively). This means that, despite the strong contemporaneous correlation, neither variable reliably predicts the other temporally — a critical distinction between correlation and causal or predictive directionality.
Notable Patterns, Clusters, and Non-Linearity
Several structural features stand out in the sample points. There is a dense cluster in the lower-left region (oil < $30, yields 8–11%), representing data predominantly from the late 1980s through mid-1990s. A second dispersed cluster occupies the middle zone ($40–$90 oil, yields 4–7%), and a sparser high-oil cluster ($100–$140, yields 4–6%) anchors the upper right. Notably, the relationship appears non-linear: yields compress into a narrow band (4–7%) across a very wide oil price range ($50–$140), suggesting diminishing marginal association at higher oil prices. Some outliers are visible — for example, points near ($16–$20, 10–11%) and ($56, 3.4%) — the latter suggesting that low bond yields are not exclusively tied to high oil prices. A purely linear model may be misspecifying the functional form.
Confounding Factors and Caveats
The most critical caveat is that both variables are strongly driven by shared macroeconomic time trends rather than a direct causal mechanism between them. Baa bond yields have declined structurally since the 1980s due to falling inflation, Federal Reserve policy, and global capital flows — entirely independently of oil. Simultaneously, Brent crude rose from under $20 to over $100 largely due to emerging market demand and supply constraints. This makes the observed correlation a likely case of spurious co-trending (common trends driving both series), which explains why Granger causality finds no predictive relationship. Additionally, the relationship likely shifts across economic regimes: during recessions (e.g., 2008–2009), oil prices and bond yields may move together (both falling) rather than inversely. Omitted variables such as the federal funds rate, inflation expectations, credit cycles, and global growth are almost certainly responsible for much of the explained variance attributed to oil prices.
Actionable Insights and Further Investigation
Given the spurious trend concern, the most important next step would be to detrend or difference both series and re-examine the correlation on stationary data — the relationship may weaken substantially or disappear. It would also be valuable to test across distinct economic regimes (pre-/post-2000, recession vs. expansion periods) to assess structural stability, and to incorporate inflation or real interest rate controls to isolate the oil-yield relationship from monetary policy effects. Extending the Granger causality test to multiple lags (beyond lag 1) could reveal delayed predictive dynamics, particularly around oil price shocks. Finally, a multivariate model incorporating the fed funds rate, CPI, and credit spreads would likely absorb much of the oil-yield correlation, providing a cleaner test of whether any independent relationship between crude prices and corporate borrowing costs actually exists.
X dataset: Brent Crude Oil Prices: Daily (DCOILBRENTEU) – FRED St. Louis Fed
Y dataset: FRED – Corporate Bond Yield (Moody's Baa)
Part of experiment: Daily - Brent Crude Oil Prices: Daily (DCOILBRENTEU) – FRED St. Louis Fed vs FRED – Corporate Bond Yield (Moody's Baa)