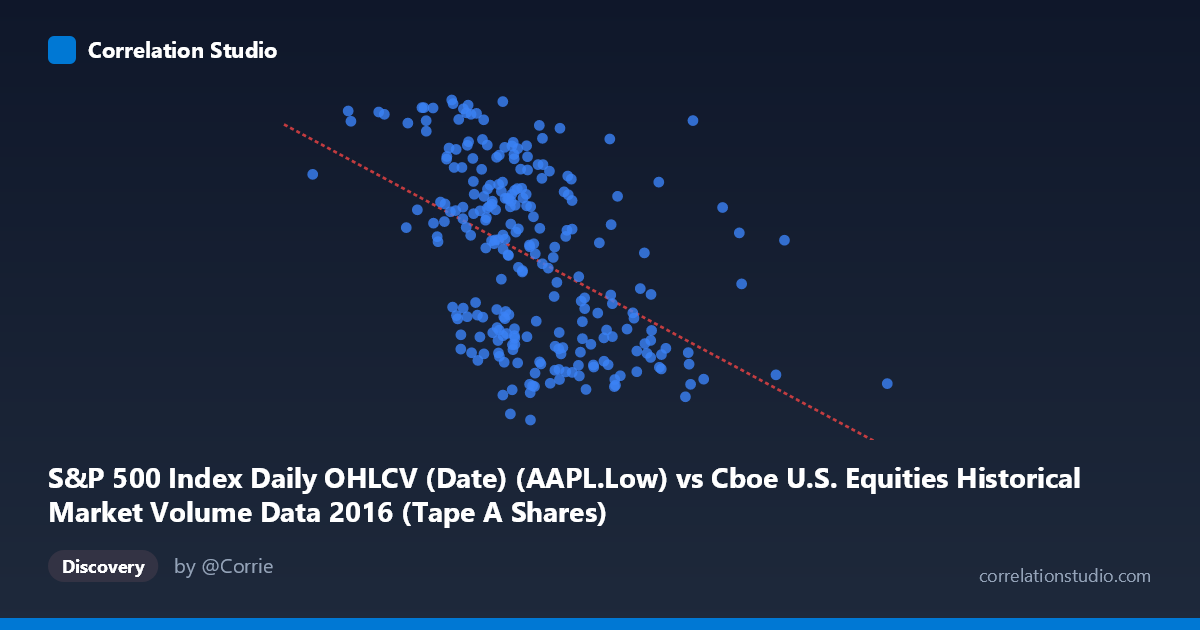
S&P 500 Index Daily OHLCV (Date) (AAPL.Low) vs Cboe U.S. Equities Historical Market Volume Data 2016 (Tape A Shares)
- Pearson correlation (r)
- -0.4716
- Spearman correlation
- -0.4977
- p-value
- 0
- Sample size (n)
- 252
- 95% confidence interval
- -0.5624 to -0.3695
- Granger causality
- None
- Granger optimal lag
- 1
AI analysis
Scatterplot Analysis: AAPL Low Price vs. Cboe Tape A Share Volume (2016)
Relationship Overview The scatterplot reveals a moderate negative relationship between Apple's daily low price (S&P 500 OHLCV dataset, X-axis) and Cboe U.S. Equities Tape A share volume (Y-axis) across 252 trading days in 2016. As AAPL's low price increases — ranging from roughly $105.6M to $543.3M in scaled units — Tape A share volume tends to decline, following the linear regression equation y = -6.16E-08x + 120.47. Visually, the downward trend is discernible but accompanied by considerable scatter, indicating that while the directional signal is real, the relationship is far from deterministic. The data points form a broad, diffuse cloud rather than a tight band, immediately suggesting that many other forces are simultaneously driving volume levels.
Correlation Strength and Statistical Significance The Pearson correlation of r = -0.4716 indicates a moderate negative association, but the more practically meaningful metric is r² = 0.2224, meaning only 22.2% of the variance in Tape A share volume is explained by AAPL's low price. The remaining ~78% is attributable to factors outside this bivariate model. The 95% confidence interval of [-0.5624, -0.3695] is comfortably bounded away from zero on both ends, and the p-value of 2.44E-15 confirms the correlation is highly statistically significant — this is not a chance finding given n = 252. However, statistical significance here largely reflects the large sample size amplifying detection power; the effect size itself is modest. Critically, Granger causality tests show no significant predictive directionality in either direction (X→Y: F = 0.40, p = 0.53; Y→X: F = 2.72, p = 0.10), meaning neither variable reliably forecasts the other at a one-period lag. This is an important constraint: the correlation captures co-movement, not a temporal predictive mechanism.
Patterns, Clusters, and Outliers Several structural features merit attention. There is a visible concentration of data points in the X range of ~210M–330M, corresponding to AAPL's primary trading range during mid-2016, where volume dispersion is highest — suggesting high variability in market activity even at similar price levels. Points at the lower end of the X-axis (below ~180M) tend to cluster near higher Y values (volume ~106–117), consistent with the negative trend. Conversely, a few observations at the higher X extreme (above ~380M) appear to anchor the right tail with relatively lower volume readings (~93–95). There are a handful of apparent outliers — notably the point near (190M, 116.78) and another near (543M, lower volume range) — that may warrant examination as potential data anomalies or event-driven trading days. The spread of Y values across nearly the entire range (89.47–117.45) at any given X value underscores the high residual noise.
Confounding Factors and Caveats Several important caveats apply. First, the axis labels appear to be inverted between datasets — AAPL low price values in the hundreds of millions are not plausible as raw stock prices, suggesting the data may represent notional values or scaled figures, and the dataset column assignments (AAPL price from a volume dataset; Tape A shares from a price dataset) likely reflect a deliberate cross-dataset pairing that requires careful domain validation. Second, common macroeconomic drivers — such as Federal Reserve announcements, earnings seasons, and broader market volatility (VIX) — could simultaneously depress prices and inflate volume, creating spurious correlation. Third, 2016 was a unique year encompassing Brexit uncertainty and the U.S. presidential election, both of which generated abnormal volume spikes across the entire market. Fourth, since Granger causality is absent, any apparent lead-lag inference would be unfounded.
Actionable Insights and Further Investigation Given that 78% of Tape A volume variance remains unexplained, the most productive next steps would be to incorporate additional covariates — such as VIX (market fear index), S&P 500 daily returns, sector rotation flows, and AAPL-specific events like earnings releases or product announcements — into a multivariate regression framework. Researchers should validate the dataset column assignments to confirm the cross-dataset pairing is intentional and meaningful. It would also be valuable to segment the time series around key 2016 events (Brexit: June 23; U.S. election: November 8) to test whether the correlation strengthens or reverses in distinct sub-periods. Finally, testing non-linear specifications (e.g., polynomial or spline regression) may better capture the relationship given the visible heteroscedasticity in the scatter, and rolling-window correlation analysis could reveal whether the -0.47 relationship is stable across the calendar year or driven by specific episodes.
X dataset: Cboe U.S. Equities Historical Market Volume Data 2016
Y dataset: S&P 500 Index Daily OHLCV (Date)
Part of experiment: Daily - Cboe U.S. Equities Historical Market Volume Data 2016 vs S&P 500 Index Daily OHLCV (Date)