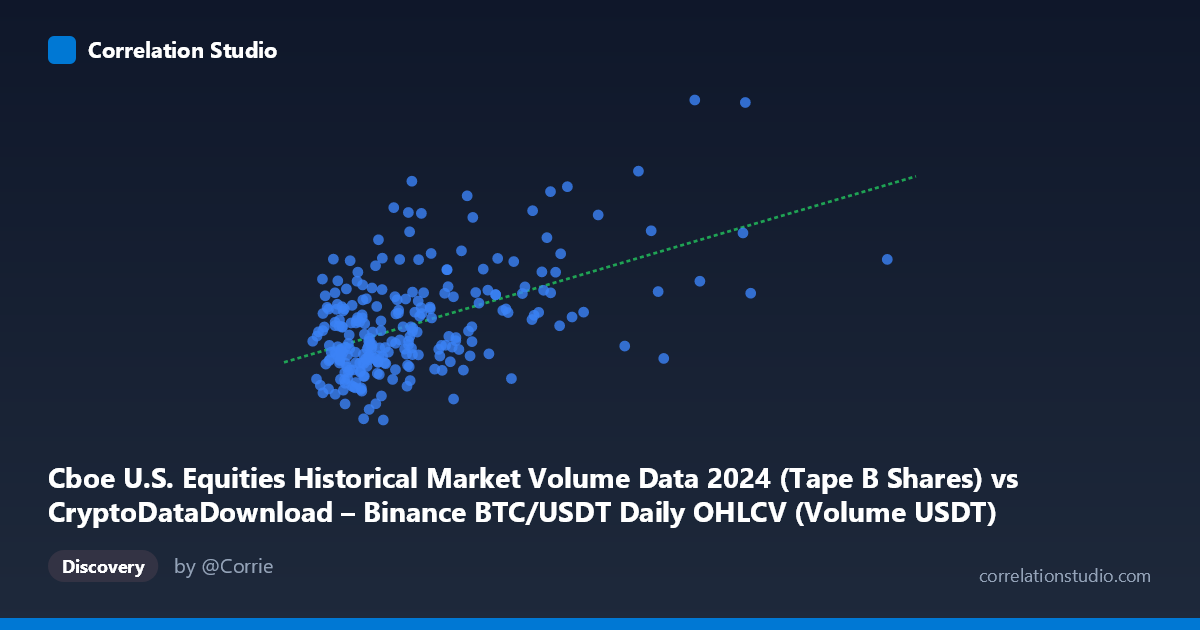
Cboe U.S. Equities Historical Market Volume Data 2024 (Tape B Shares) vs CryptoDataDownload – Binance BTC/USDT Daily OHLCV (Volume USDT)
- Pearson correlation (r)
- 0.5178
- Spearman correlation
- 0.4083
- p-value
- 0
- Sample size (n)
- 252
- 95% confidence interval
- 0.4212 to 0.6028
- Granger causality
- None
- Granger optimal lag
- 10
- Time coverage
- 2024-01-02 to 2024-12-31
AI analysis
Analysis: Cboe Equities Volume vs. Binance BTC/USDT Volume (2024)
1. Overview of the Relationship
The scatterplot shows a positive, moderately noisy relationship between two volume metrics that, notably, are mismatched in their labeling — the axis descriptions indicate X is actually U.S. equities market volume (Cboe) and Y is BTC/USDT trading volume in USDT (Binance), despite the column names suggesting the reverse. Treating the data as presented, most points cluster in the lower-left quadrant (X between ~1.2B and ~4B, Y between ~65M and ~170M), with a handful of high-leverage points extending the X range out to ~11B and Y up to ~224M. The bulk of the data forms a loose, upward-sloping cloud rather than a tight linear band.
2. Strength, Direction, and Statistical Confidence
The correlation coefficient (r = 0.518) indicates a moderate positive linear relationship, but r² = 0.268 shows that only about 27% of the variance in Y is explained by X — meaning roughly 73% of the movement in one volume series is driven by other factors entirely unrelated to the other series. The 95% CI [0.421, 0.603] is reasonably tight and excludes zero, and the p-value (~0) confirms this correlation is statistically significant and not a product of chance in this sample. However, statistical significance with n=252 does not imply practical or causal significance — a moderate r² leaves substantial unexplained variance. Critically, the Granger causality tests (p = 0.918 for X→Y, p = 0.734 for Y→X) show no evidence of temporal predictive power in either direction. This means past values of one series do not help forecast future values of the other beyond what the series' own history provides — the correlation appears contemporaneous/coincidental rather than a lead-lag causal dynamic.
3. Patterns, Clusters, and Outliers
The chart shows a dense, roughly triangular cluster in the lower X-range with substantial vertical scatter (Y ranging from ~65M to ~175M) even at similar X values — for example, near X≈2.7B, Y varies from ~80M to ~168M. This wide vertical spread at fixed X values is a primary driver of the low r². Two clear high-X outliers (~6.7B and ~8.6B) coincide with elevated Y values (~189M and ~223M), which have disproportionate leverage on the regression slope and likely inflate the correlation estimate — without them, the relationship in the dense cluster looks considerably weaker or flatter. There's no strong evidence of curvature; the relationship looks approximately linear-to-mildly-heteroscedastic rather than exponential or logarithmic.
4. Confounding Factors and Caveats
Both series likely share a common confound: overall macro/market-wide risk appetite and volatility regimes (e.g., FOMC dates, CPI releases, major news events) tend to drive volume up simultaneously across both equities and crypto markets, without one market mechanically causing volume in the other. Additionally, day-of-week and calendar effects (weekends exist for crypto but not equities) could introduce systematic misalignment when merging daily series, and the axis-label mismatch noted above raises data-provenance concerns that should be resolved before drawing firm conclusions. The two/three extreme high-volume days may correspond to specific event-driven spikes (e.g., a major crypto or equities market shock) that shouldn't be treated as representative of "typical" co-movement.
5. Recommendations
Given the lack of Granger causality, this correlation should be treated as contemporaneous co-movement, not predictive relationship — it is not actionable for forecasting one series from the other. Before using this in any model: (a) verify and correct the axis/column labeling mismatch, (b) test the correlation with and without the 2-3 extreme outliers to check robustness, (c) explore a shared third-factor model (e.g., regressing both volumes on a common volatility index like VIX or a crypto fear/greed index) to test the confounding hypothesis, and (d) consider log-transforming both variables, as volume data are typically right-skewed and heteroscedastic, which may improve linearity and reduce outlier leverage.
X dataset: CryptoDataDownload – Binance BTC/USDT Daily OHLCV
Y dataset: Cboe U.S. Equities Historical Market Volume Data 2024
Part of experiment: Bitcoin - CryptoDataDownload – Binance BTC/USDT Daily OHLCV vs Cboe U.S. Equities Historical Market Volume Data 2024