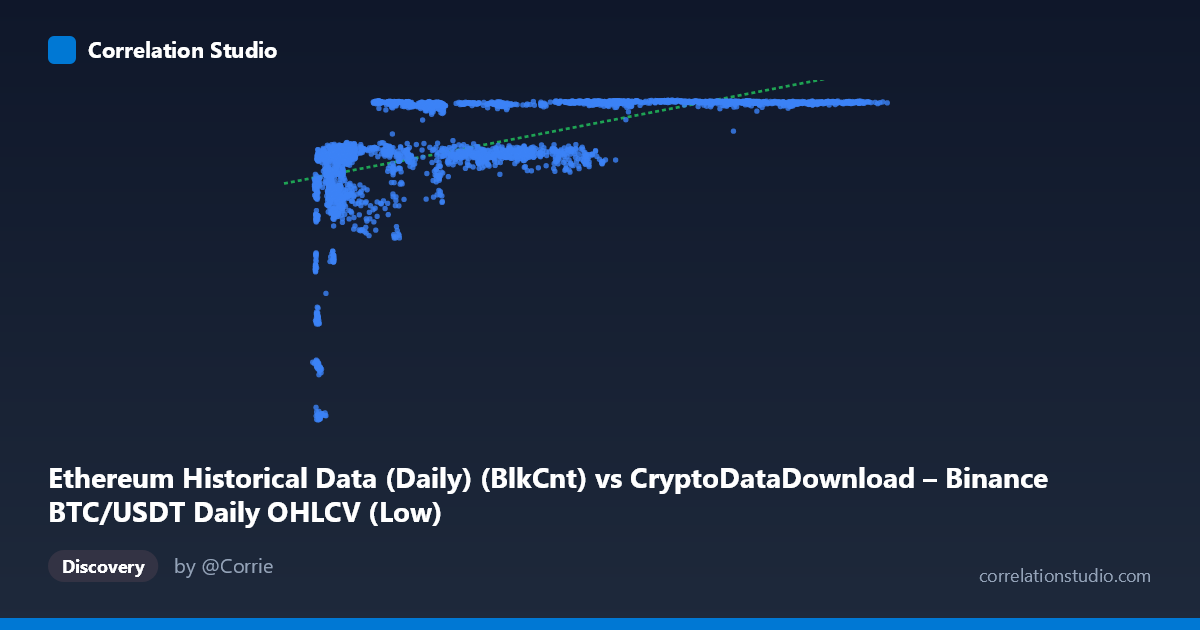
Ethereum Historical Data (Daily) (BlkCnt) vs CryptoDataDownload – Binance BTC/USDT Daily OHLCV (Low)
- Pearson correlation (r)
- 0.5738
- Spearman correlation
- 0.7333
- p-value
- 0
- Sample size (n)
- 3191
- 95% confidence interval
- 0.5501 to 0.5966
- Granger causality
- None
- Granger optimal lag
- 1
AI analysis
Analysis: BlkCnt vs. Low Price Relationship
1. Overview of the Relationship
The scatterplot shows a moderate positive association between the X variable (labeled "BlkCnt" but ranging into the tens of thousands—likely a mislabeled or composite metric) and Y (price-like values clustered mostly between 5,900–7,190). The relationship is clearly not linear: at low X values (under ~15,000), Y rises steeply and almost vertically, climbing from ~2,800 to ~6,500 with only small increases in X. Beyond X≈20,000–30,000, Y plateaus sharply, hovering in a tight band around 7,100–7,180 regardless of whether X is 30,000 or 120,000. This produces a classic logarithmic or saturating curve shape rather than a straight line.
2. Strength, Direction, and Statistical Confidence
The Pearson correlation (r = 0.574) indicates a moderate positive linear relationship, but r² = 0.329 means only about 33% of the variance in Y is explained by a linear fit with X — two-thirds of Y's variability is driven by other factors or by the nonlinear shape the linear model fails to capture. The 95% CI [0.550, 0.596] is narrow, and p ≈ 0 confirms this correlation is highly unlikely due to chance, given the large sample (n = 3,191). However, statistical significance here reflects sample size, not necessarily practical strength or a causal link. The Granger causality tests are important: neither direction shows significant predictive power (X→Y: p=0.49; Y→X: p=0.86), meaning despite the correlation, past values of one variable do not meaningfully help forecast future values of the other. This suggests the relationship is likely driven by a shared external trend (e.g., both series trending upward over the 2017–2026 period) rather than one variable causing or leading the other.
3. Notable Patterns and Features
The most striking feature is the early steep ramp: at very low X (3,000–12,000), Y spans almost the entire lower half of its range (2,800–6,500), indicating high sensitivity in this region. Once X exceeds ~25,000–30,000, Y saturates near its ceiling (~7,100–7,190) and stays flat even as X grows 4–5x further — a strong diminishing-returns / logarithmic pattern. This matches the note that Spearman ρ likely exceeds Pearson r, confirming the rank-order relationship is stronger than the linear one. The saturation ceiling near 7,150–7,190 hints Y may be capped, bucketed, or measuring something with a hard upper limit (unusual for a raw "Low" price series, suggesting a possible normalization, rounding, or data-quality artifact).
4. Confounding Factors and Caveats
Several caveats limit interpretation: (a) the axis labels appear mismatched or garbled — X is described as "BlkCnt" from an Ethereum dataset but attributed to BTC/USDT OHLCV, while Y is a "Low" price attributed to Ethereum network data; this metadata inconsistency undermines confident causal storytelling. (b) Both series likely share a common time trend (long-run crypto market growth from 2017–2026), which alone can inflate correlation without genuine mechanistic linkage (spurious correlation via co-trending). (c) The linear model is a poor fit given the visible curvature — a log or power transform of X would likely raise explained variance substantially. (d) The tight Y ceiling suggests possible data capping, exchange-specific quirks, or a derived/bucketed metric rather than a raw continuous price.
5. Recommendations for Further Investigation
First, verify and correct the axis/column labeling to ensure the two series are genuinely from comparable, correctly-aligned timeframes and assets. Second, refit using a logarithmic or power transformation of X (e.g., y ~ log(x)) given the clear saturation curve — this should meaningfully improve R² over the linear 33%. Third, since Granger tests show no lead-lag predictability, avoid using either series to forecast the other in a trading/predictive model; instead, treat the correlation as co-movement from shared market cycles, and consider detrending or differencing both series before re-testing correlation to rule out spurious trend-driven association. Finally, isolate and inspect points below X=15,000 separately, as this low-X regime carries most of the explanatory signal and may warrant its own model or regime-based analysis.
X dataset: CryptoDataDownload – Binance BTC/USDT Daily OHLCV
Y dataset: Ethereum Historical Data (Daily)
Part of experiment: Bitcoin - CryptoDataDownload – Binance BTC/USDT Daily OHLCV vs Ethereum Historical Data (Daily)