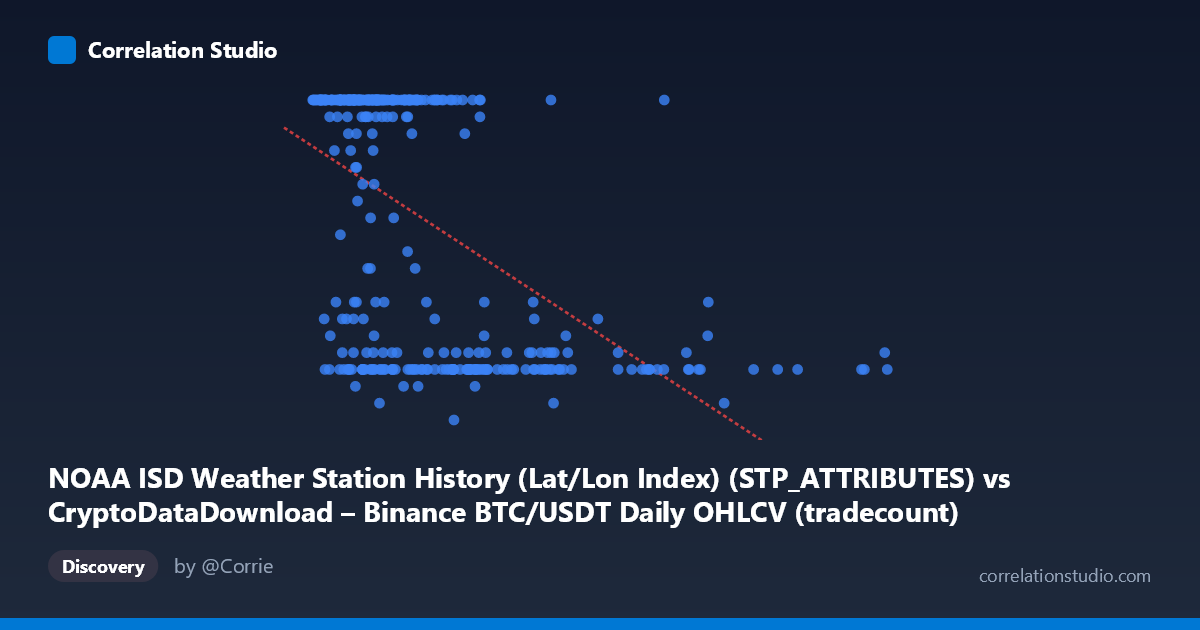
NOAA ISD Weather Station History (Lat/Lon Index) (STP_ATTRIBUTES) vs CryptoDataDownload – Binance BTC/USDT Daily OHLCV (tradecount)
- Pearson correlation (r)
- -0.5351
- Spearman correlation
- -0.5342
- p-value
- 0
- Sample size (n)
- 355
- 95% confidence interval
- -0.6055 to -0.4564
- Granger causality
- None
- Granger optimal lag
- 1
AI analysis
Analysis: X-axis Metric vs. Y-axis Metric
1. Overview of the Relationship
The scatterplot depicts a moderate negative association between the two variables, with values on the Y-axis clustering heavily near the ceiling (values of 24) at lower X-axis values, then showing a wider, more scattered spread — including many low values (7-12) — as X increases. This creates a somewhat wedge- or fan-shaped pattern rather than a clean linear trend, suggesting the relationship is more probabilistic than deterministic.
2. Strength, Direction, and Statistical Confidence
The correlation coefficient of r = -0.535 indicates a moderate negative relationship: as X increases, Y tends to decrease. However, r² = 0.286 reveals that only about 28.6% of the variance in Y is explained by X — meaning roughly 71% of the variability is driven by other factors not captured in this simple linear model. The 95% confidence interval [-0.606, -0.456] is reasonably tight and does not cross zero, and the p-value of 0 confirms this correlation is highly statistically significant (unlikely due to chance) given the large sample size (n=355). That said, statistical significance here reflects sample size more than practical strength — a moderate r² still leaves substantial unexplained variance. Critically, the Granger causality tests show no significant predictive direction in either direction (X→Y: p=0.80; Y→X: p=0.34), meaning neither variable reliably "leads" the other in time. This strongly suggests the correlation is either contemporaneous, coincidental, or driven by a shared external factor — not a causal, forecastable relationship.
3. Notable Patterns and Outliers
Several structural features stand out: - Ceiling clustering: A large cluster of points sits at Y=24 (the apparent maximum) across a wide range of X values, suggesting possible data truncation, capping, or a natural upper bound rather than a true linear ceiling. - Bimodal tendency: Many points fall either near Y=24 or in a lower band (Y=7-12), with fewer points in the middle range (13-20), hinting at two distinct regimes or subpopulations rather than one continuous relationship. - High-X outliers: Points beyond X=5,000,000 (up to ~12,000,000) consistently show low Y values (8-10), pulling the regression line downward and potentially exerting disproportionate leverage on the slope estimate.
4. Confounding Factors and Caveats
This dataset pairing is unusual and warrants scrutiny: the X-axis is labeled as a NOAA weather station index while the metadata describes it as Bitcoin OHLCV data, and the Y-axis is labeled Binance tradecount but described as weather station data. This mismatch suggests column/label misalignment in the source data pipeline — a serious caveat. If the axes are genuinely mismatched or mislabeled, any correlation may be spurious or an artifact of data joining errors (e.g., merging unrelated datasets by row index rather than by meaningful key). Additionally, the ceiling effect at Y=24 could reflect a capped/binned variable (e.g., hours in a day, categorical scale) rather than a continuous measurement, which would violate assumptions of linear regression and inflate or distort the correlation estimate.
5. Recommendations for Further Investigation
Before drawing substantive conclusions: (1) verify data provenance and column labeling — confirm what X and Y actually represent, since the current metadata is contradictory; (2) investigate the ceiling at Y=24 to determine if it's a true bound, a capped value, or a data quality issue, and consider a censored regression model if so; (3) test for non-linear or threshold relationships (e.g., piecewise or logistic models) given the fan-shaped, bimodal pattern; (4) examine the high-leverage points at extreme X values separately, as they may represent a distinct subgroup or data errors; and (5) given the null Granger causality result, avoid using this relationship for predictive or forecasting purposes — treat it as descriptive/correlational only, and search for a plausible confounding variable (e.g., time-of-year, station location, or data collection method) that might jointly explain both series.
X dataset: CryptoDataDownload – Binance BTC/USDT Daily OHLCV
Y dataset: NOAA ISD Weather Station History (Lat/Lon Index)
Part of experiment: Bitcoin - CryptoDataDownload – Binance BTC/USDT Daily OHLCV vs NOAA ISD Weather Station History (Lat/Lon Index)