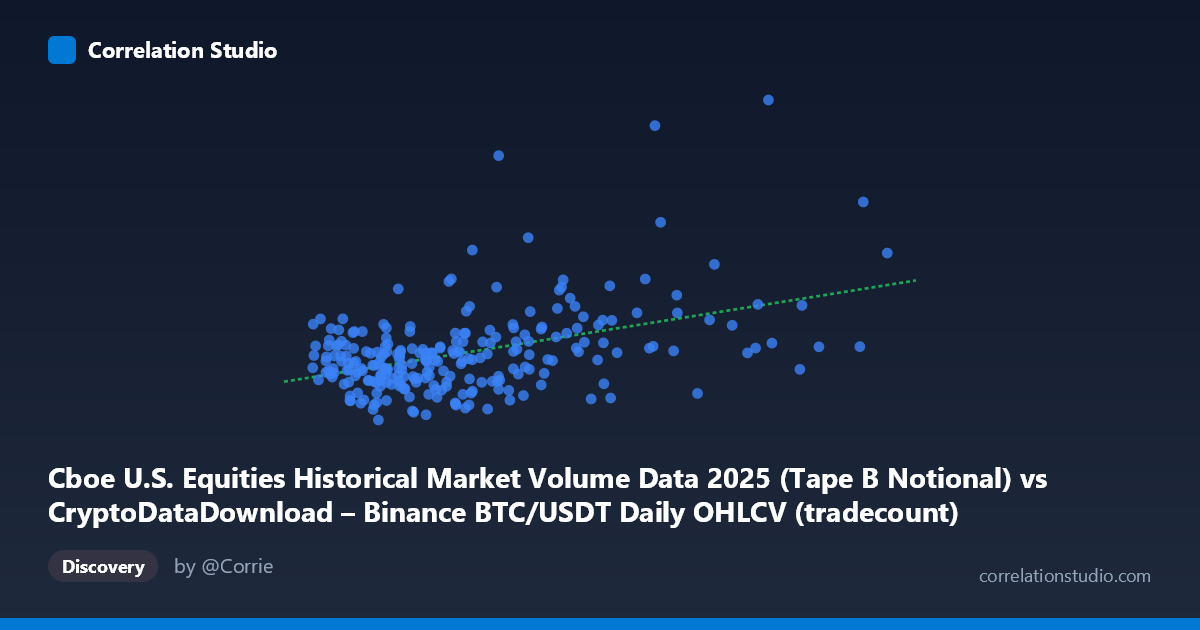
Cboe U.S. Equities Historical Market Volume Data 2025 (Tape B Notional) vs CryptoDataDownload – Binance BTC/USDT Daily OHLCV (tradecount)
- Pearson correlation (r)
- 0.443
- Spearman correlation
- 0.3257
- p-value
- 0
- Sample size (n)
- 250
- 95% confidence interval
- 0.3374 to 0.5375
- Granger causality
- None
- Granger optimal lag
- 10
- Time coverage
- 2025-01-02 to 2025-12-31
AI analysis
Analysis of Cboe Equities Volume vs. Binance BTC/USDT Metrics
1. Overview of the Relationship
The scatterplot depicts a moderate positive association between the X variable (Cboe U.S. Equities notional volume, Tape B) and the Y variable (Binance BTC/USDT tradecount). As X increases, Y tends to increase as well, but the relationship is loose and noisy rather than tight or deterministic. Points are scattered broadly around the fitted regression line (y = 583.55x + 6.41B), with substantial vertical dispersion at every level of X, particularly in the lower X range (2M–4M) where the bulk of observations cluster.
2. Strength, Direction, and Statistical Confidence
The correlation coefficient (r = 0.443) indicates a moderate positive linear relationship, but r² = 0.196 reveals that only about 19.6% of the variance in tradecount is explained by equities volume — meaning roughly 80% of the variation in Y is driven by other factors entirely unrelated to this X variable. The 95% confidence interval [0.337, 0.538] is reasonably narrow given the sample size (n=250 from a population of 3,212), and the p-value (1.94E-13) confirms the correlation is highly statistically significant — this is not due to chance. However, statistical significance and practical significance diverge here: a real but modest relationship exists, insufficient for reliable point prediction. Critically, Granger causality testing shows no significant predictive direction in either direction (X→Y: p=0.631; Y→X: p=0.594). This means neither variable's past values help forecast the other's future values at any tested lag (up to 10 periods) — the correlation is likely contemporaneous/coincidental or driven by a shared external factor, not a temporal lead-lag mechanism.
3. Patterns, Clusters, and Outliers
The data shows a dense cluster of low-X points (2M–4M range) with Y values spanning widely from ~5.7B to ~10.5B, suggesting high variance in tradecount even when equities volume is low and stable. A secondary, more sparse cluster appears at higher X values (6M–9.8M) with correspondingly elevated Y values (9B–14.6B), which is consistent with the positive slope but also introduces leverage points that may be disproportionately influencing the regression fit. No strong nonlinear curvature (e.g., logarithmic or exponential bending) is visually obvious; the relationship appears roughly linear but heteroscedastic — the spread of Y widens somewhat as X increases, hinting at non-constant variance rather than a clean linear signal.
4. Confounding Factors and Caveats
Several caveats warrant attention. First, this pairing is unusual: it compares a traditional equities market volume metric (Cboe) against a crypto exchange trade count (Binance) — two structurally different markets with different participants, trading hours, and regulatory environments. Any correlation may reflect a shared macro driver (e.g., overall market risk appetite, volatility regimes, algorithmic trading activity, or broad liquidity conditions across asset classes) rather than a direct causal link. Second, both series may exhibit autocorrelation (trending behavior over the 2025 calendar year) that can inflate correlation estimates without reflecting genuine covariation — this is a common issue in time series merged by date. Third, the lack of Granger causality suggests that even if a mechanism exists, it operates faster than daily resolution or through a lurking third variable not captured in this bivariate analysis.
5. Actionable Recommendations
Given the modest r², non-causal Granger result, and cross-market nature of the variables, this correlation should not be used for predictive trading models in its current bivariate form. Instead: (a) test for a common confounding variable — e.g., VIX, overall crypto market cap, or a liquidity/volatility index — that might explain co-movement in both series; (b) apply differencing or detrending to rule out spurious correlation from shared trends; (c) explore contemporaneous correlation at finer granularity (intraday) to check if the relationship strengthens or vanishes at higher frequency; and (d) investigate whether specific calendar events (e.g., FOMC dates, crypto-specific news) drive simultaneous spikes in both series, which would explain the correlation without any direct causal or predictive linkage.
X dataset: CryptoDataDownload – Binance BTC/USDT Daily OHLCV
Y dataset: Cboe U.S. Equities Historical Market Volume Data 2025
Part of experiment: Bitcoin - CryptoDataDownload – Binance BTC/USDT Daily OHLCV vs Cboe U.S. Equities Historical Market Volume Data 2025