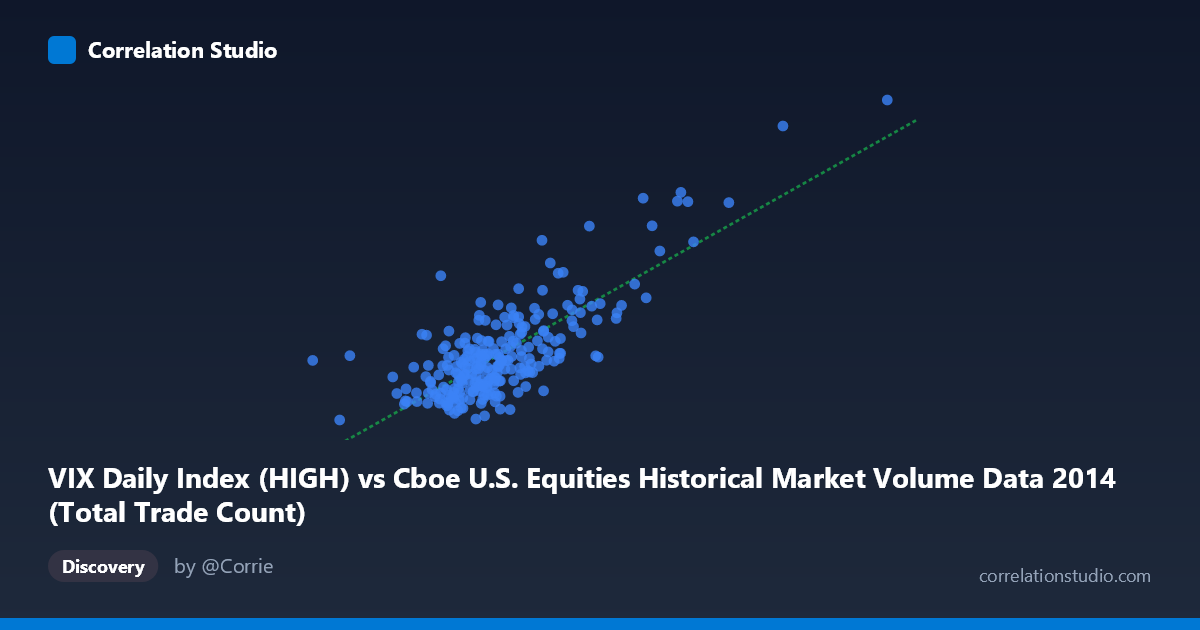
VIX Daily Index (HIGH) vs Cboe U.S. Equities Historical Market Volume Data 2014 (Total Trade Count)
- Pearson correlation (r)
- 0.7833
- Spearman correlation
- 0.6323
- p-value
- 0
- Sample size (n)
- 252
- 95% confidence interval
- 0.7304 to 0.8268
- Granger causality
- None
- Granger optimal lag
- 1
AI analysis
Analysis: VIX Daily Index (HIGH) vs. Total Trade Count (2014)
Relationship Overview The scatterplot reveals a moderately strong positive relationship between the VIX Daily Index High values and the Total Trade Count for U.S. equities in 2014. As VIX High values increase, total trade counts tend to rise correspondingly, which is intuitively sensible: elevated volatility typically drives greater market participation, hedging activity, and speculative trading. The linear regression equation (y = 5.87×10⁻⁶x + 2.86) captures this upward trend, though the scatter around the regression line suggests the relationship is not perfectly linear across all ranges, particularly at higher VIX values where dispersion visibly widens.
Correlation Strength and Statistical Significance The Pearson correlation of r = 0.7833 indicates a strong positive association, with r² = 0.6136 meaning that approximately 61.4% of the variance in Total Trade Count is explained by VIX High levels — a substantial but incomplete explanation, leaving roughly 38.6% attributable to other factors. The 95% confidence interval of [0.7304, 0.8268] is relatively narrow given the sample size of n = 252 (drawn from a population of N = 3,686), and the p-value of essentially zero confirms this relationship is highly unlikely to be a statistical artifact. However, the Granger causality results complicate the narrative: neither direction (X→Y: F = 2.23, p = 0.137; Y→X: F = 0.10, p = 0.752) reaches significance at conventional thresholds, meaning that despite the strong contemporaneous correlation, past VIX values do not reliably predict future trade counts, nor vice versa, at a one-period lag. This suggests both variables may be reacting simultaneously to the same market conditions rather than one leading the other.
Notable Patterns, Clusters, and Outliers The data exhibits a clear clustering at lower VIX values (roughly 10–18), where the bulk of 2014's trading days resided — a period of relatively subdued volatility. Within this cluster, the relationship is tighter and the regression line fits reasonably well. However, there are several conspicuous high-leverage outliers in the upper-right quadrant, with VIX High values approaching 30+ and Trade Counts well above 3,500,000–4,000,000. Points such as (3,772,957, 29.41) and (3,153,910, 25.20) appear to correspond to specific volatility events in 2014 (likely the October market selloff), and these outliers exert disproportionate influence on the correlation coefficient. The heteroscedasticity is notable: variance in Trade Count increases substantially at higher VIX levels, suggesting the relationship becomes less predictable — and potentially more non-linear — during stress periods.
Confounding Factors and Caveats Several important caveats apply. First, 2014 was not a uniform year — it included distinct volatility regimes (calm spring/summer vs. turbulent autumn), meaning the correlation may be heavily regime-dependent rather than a stable structural relationship. Second, both variables are likely driven by common underlying factors — macroeconomic news, geopolitical events, or Federal Reserve communications — which could explain the strong contemporaneous correlation without implying any direct causal mechanism. Third, the dataset labels appear to have the axes inverted from their source datasets (VIX column listed under equities volume data, and vice versa), which warrants verification before drawing firm conclusions. Finally, daily aggregation may mask intraday dynamics where the relationship could be stronger or weaker at different time scales.
Actionable Insights and Further Investigation Practitioners should treat VIX levels as a useful but imperfect contemporaneous signal for expected trading volume, potentially informing exchange capacity planning or liquidity provision strategies. Given the Granger non-causality result, strategies that attempt to predict trade volume from prior-day VIX (or vice versa) should be treated skeptically without further validation. Recommended next steps include: (1) testing non-linear models (e.g., log-log transformation) to better capture the relationship at extreme VIX values; (2) segmenting the analysis by volatility regime to assess whether correlations differ meaningfully in calm vs. stressed markets; (3) introducing additional explanatory variables (e.g., S&P 500 returns, options expiration calendar, macroeconomic releases) to account for the unexplained 38.6% variance; and (4) extending the analysis across multiple years to assess whether this 2014-specific pattern is structurally persistent.
X dataset: Cboe U.S. Equities Historical Market Volume Data 2014
Y dataset: VIX Daily Index
Part of experiment: Daily - Cboe U.S. Equities Historical Market Volume Data 2014 vs VIX Daily Index