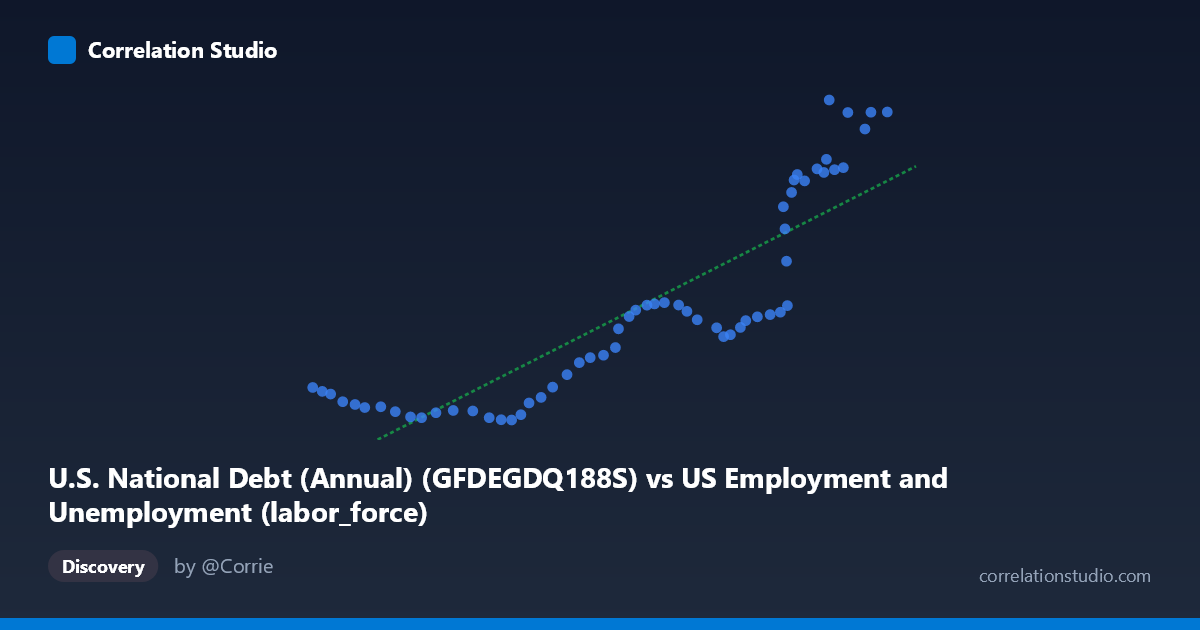
U.S. National Debt (Annual) (GFDEGDQ188S) vs US Employment and Unemployment (labor_force)
- Pearson correlation (r)
- 0.8665
- Spearman correlation
- 0.9156
- p-value
- 0
- Sample size (n)
- 60
- 95% confidence interval
- 0.7854 to 0.9184
- Granger causality
- None
- Granger optimal lag
- 10
- Time coverage
- 1966-01-01 to 2025-01-01
- Recomputed on refreshed data
- 2026-10-11 (r was 0.8665)
AI analysis
Scatterplot Analysis: U.S. National Debt (% GDP) vs. Labor Force Size
1. Overall Relationship
The scatterplot reveals a clear positive relationship between U.S. National Debt as a percentage of GDP and the size of the U.S. labor force over the period 1966–2025. As the labor force grew from roughly 75,770 (thousands) to over 170,000, national debt as a percent of GDP rose from approximately 31% to as high as 124%. The linear regression line (y = 0.000894x − 52.16) fits the data reasonably well across much of the range, though the scatter widens noticeably at higher X values, suggesting the relationship becomes less predictable as the labor force expands into more recent decades.
2. Correlation Strength and Statistical Interpretation
The Pearson correlation of r = 0.8665 indicates a strong positive association, and the R² = 0.7508 means that approximately 75% of the variance in national debt (% GDP) is explained by labor force size — a substantial share, though it also means 25% of the variation is attributable to other factors. The 95% confidence interval of [0.7854, 0.9184] is relatively narrow, reinforcing confidence that this is a robust correlation rather than a chance artifact, and the p-value ≈ 0 confirms high statistical significance across the sample of n = 60 paired observations. However, the Granger causality tests are telling: neither direction (X→Y nor Y→X) reaches significance (F = 0.89, p = 0.55 and F = 1.57, p = 0.17, respectively). This means that despite the strong contemporaneous correlation, neither variable reliably predicts the other temporally — a critical caution against any causal interpretation.
3. Notable Patterns, Clusters, and Outliers
The data visually separates into at least two distinct behavioral regimes: - A low-debt cluster (labor force ~75,000–130,000; debt ~30–65% GDP) where points are tightly packed and relatively linear — corresponding roughly to the 1966–1990s era when debt was more stable. - A high-debt, high-variance cluster (labor force ~145,000–170,000; debt ~55–124% GDP) showing dramatically wider vertical spread — reflecting post-2008 and COVID-era debt surges. Points like (161,204; 124.04) and (160,742; 106.77) sit well above the regression line, while (153,124; 62.25) and (154,287; 64.17) sit well below it, despite similar labor force sizes. This fan-shaped heteroscedasticity suggests the linear model is less reliable at larger labor force values and hints at a structural break in the relationship over time.
4. Confounding Factors and Caveats
This correlation is almost certainly driven by a common underlying driver: time. Both the labor force and national debt have trended upward over the 60-year span studied, making this a textbook case of spurious correlation via shared temporal trend. Major confounders include population growth (which mechanically increases both variables), macroeconomic shocks (the 2008 financial crisis, COVID-19 pandemic) that spiked debt independently of labor market dynamics, and fiscal policy decisions entirely unrelated to labor force size. The absence of Granger causality reinforces this — the variables move together over time but do not "cause" each other in any predictive sense. Treating this correlation as evidence that a larger workforce drives debt accumulation (or vice versa) would be misleading without detrending both series or controlling for GDP, population, and policy variables.
5. Actionable Insights and Further Investigation
Given these findings, several analytical steps would sharpen interpretation: - Detrend both series (e.g., first-differencing or HP filter) to test whether a correlation persists after removing shared time trends — this would be the most immediate diagnostic for spuriousness. - Introduce structural break tests around 2008 and 2020 to formally quantify the regime shift visible in the scatterplot's upper cluster. - Multivariate regression incorporating GDP growth, unemployment rate, and government spending as controls would reveal whether labor force size retains any independent explanatory power over debt levels. - Segment the analysis by era (pre-/post-2008) to assess whether the relationship has meaningfully changed in character, given the visible heteroscedasticity. - Policymakers should resist interpreting this chart as implying that labor force expansion "causes" debt growth; the more actionable lens is that both variables reflect long-run demographic and economic trends that need to be managed through independent fiscal and labor policy levers.
X dataset: US Employment and Unemployment
Y dataset: U.S. National Debt (Annual)
Part of experiment: Yearly - US Employment and Unemployment vs U.S. National Debt (Annual)